
Generating DAG list from data using Population-Based Incremental learning
Usage
LDLRA_PBIL(
  U,
  na = NULL,
  Z = NULL,
  w = NULL,
  seed = 123,
  ncls = 2,
  method = "R",
  population = 20,
  Rs = 0.5,
  Rm = 0.002,
  maxParents = 2,
  maxGeneration = 100,
  successiveLimit = 5,
  elitism = 0,
  alpha = 0.05,
  estimate = 1,
  filename = NULL,
  verbose = FALSE,
  beta1 = 2,
  beta2 = 2
)
Arguments
- U
U is either a data class of exametrika, or raw data. When raw data is given, it is converted to the exametrika class with the dataFormat function.
- na
na argument specifies the numbers or characters to be treated as missing values.
- Z
Z is a missing indicator matrix of the type matrix or data.frame
- w
w is item weight vector
- seed
seed for random.
- ncls
number of latent class(rank). The default is 2.
- method
specify the model to analyze the data.Local dependence latent class model is set to "C", latent rank model is set "R". The default is "R".
- population
Population size. The default is 20
- Rs
Survival Rate. The default is 0.5
- Rm
Mutation Rate. The default is 0.002
- maxParents
Maximum number of edges emanating from a single node. The default is 2.
- maxGeneration
Maximum number of generations.
- successiveLimit
Termination conditions. If the optimal individual does not change for this number of generations, it is considered to have converged.
- elitism
Number of elites that remain without crossover when transitioning to the next generation.
- alpha
Learning rate. The default is 0.05
- estimate
In PBIL for estimating the adjacency matrix, specify by number from the following four methods: 1. Optimal adjacency matrix, 2. Rounded average of individuals in the last generation, 3. Rounded average of survivors in the last generation, 4. Rounded generational gene of the last generation. The default is 1.
- filename
Specify the filename when saving the generated adjacency matrix in CSV format. The default is null, and no output is written to the file.
- verbose
verbose output Flag. default is FALSE
- beta1
Beta distribution parameter 1 for prior density. Default is 2.
- beta2
Beta distribution parameter 2 for prior density. Default is 2. Unlike the other network models (which default to 1), the default of 2 follows the original Mathematica implementation of LDLRA.
Value
- nobs
Sample size. The number of rows in the dataset.
- testlength
Length of the test. The number of items included in the test.
- crr
correct response ratio
- adj_list
adjacency matrix list
- g_list
graph list
- referenceMatrix
Learned Parameters.A three-dimensional array of patterns where item x rank x pattern.
- IRP
Marginal Item Reference Matrix
- IRPIndex
IRP Indices which include Alpha, Beta, Gamma.
- TRP
Test Reference Profile matrix.
- LRD
latent Rank/Class Distribution
- RMD
Rank/Class Membership Distribution
- TestFitIndices
Overall fit index for the test.See also TestFit
- Estimation_table
Estimated parameters tables.
- CCRR_table
Correct Response Rate tables
- Studens
Student information. It includes estimated class membership, probability of class membership, RUO, and RDO.
Details
This function performs structural learning for each classes by using the Population-Based Incremental Learning model(PBIL) proposed by Fukuda et al.(2014) within the genetic algorithm framework. Instead of learning the adjacency matrix itself, the 'genes of genes' that generate the adjacency matrix are updated with each generation. For more details, please refer to Fukuda(2014) and Section 9.4.3 of the text(Shojima,2022).
References
Fukuda, S., Yamanaka, Y., & Yoshihiro, T. (2014). A Probability-based evolutionary algorithm with mutations to learn Bayesian networks. International Journal of Artificial Intelligence and Interactive Multimedia, 3, 7–13. DOI: 10.9781/ijimai.2014.311
Examples
# \donttest{
# Perform Structure Learning for LDLRA using PBIL algorithm
# This process may take considerable time due to evolutionary optimization
result.LDLRA.PBIL <- LDLRA_PBIL(J15S500,
seed = 123, # Set random seed for reproducibility
ncls = 3, # Number of latent ranks
population = 10, # Candidate solutions evaluated per generation
maxGeneration = 5,
method = "R", # Use rank model (vs. class model)
elitism = 1, # Keep best solution in each generation
successiveLimit = 5 # Convergence criterion
)
# Examine the learned network structure
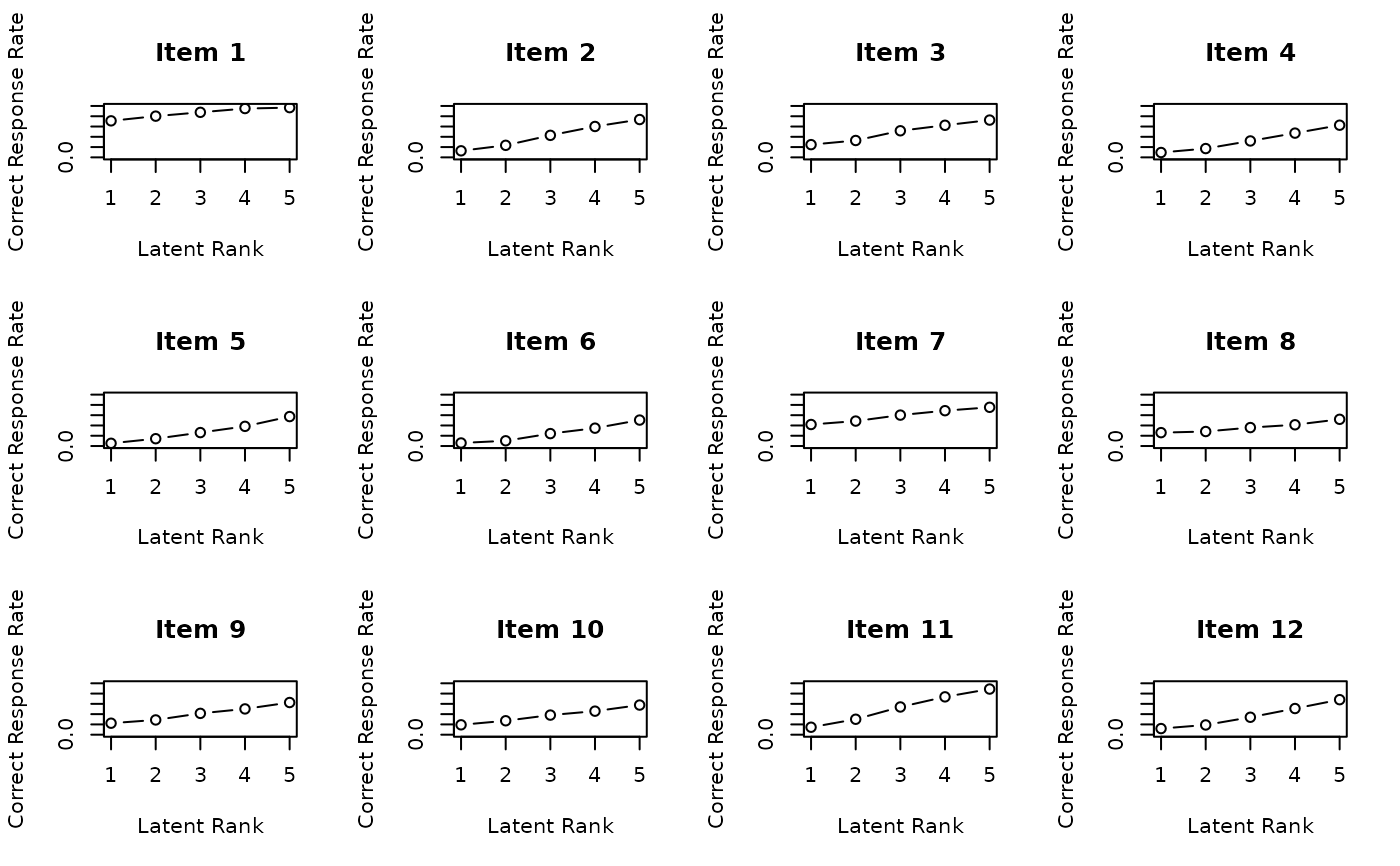
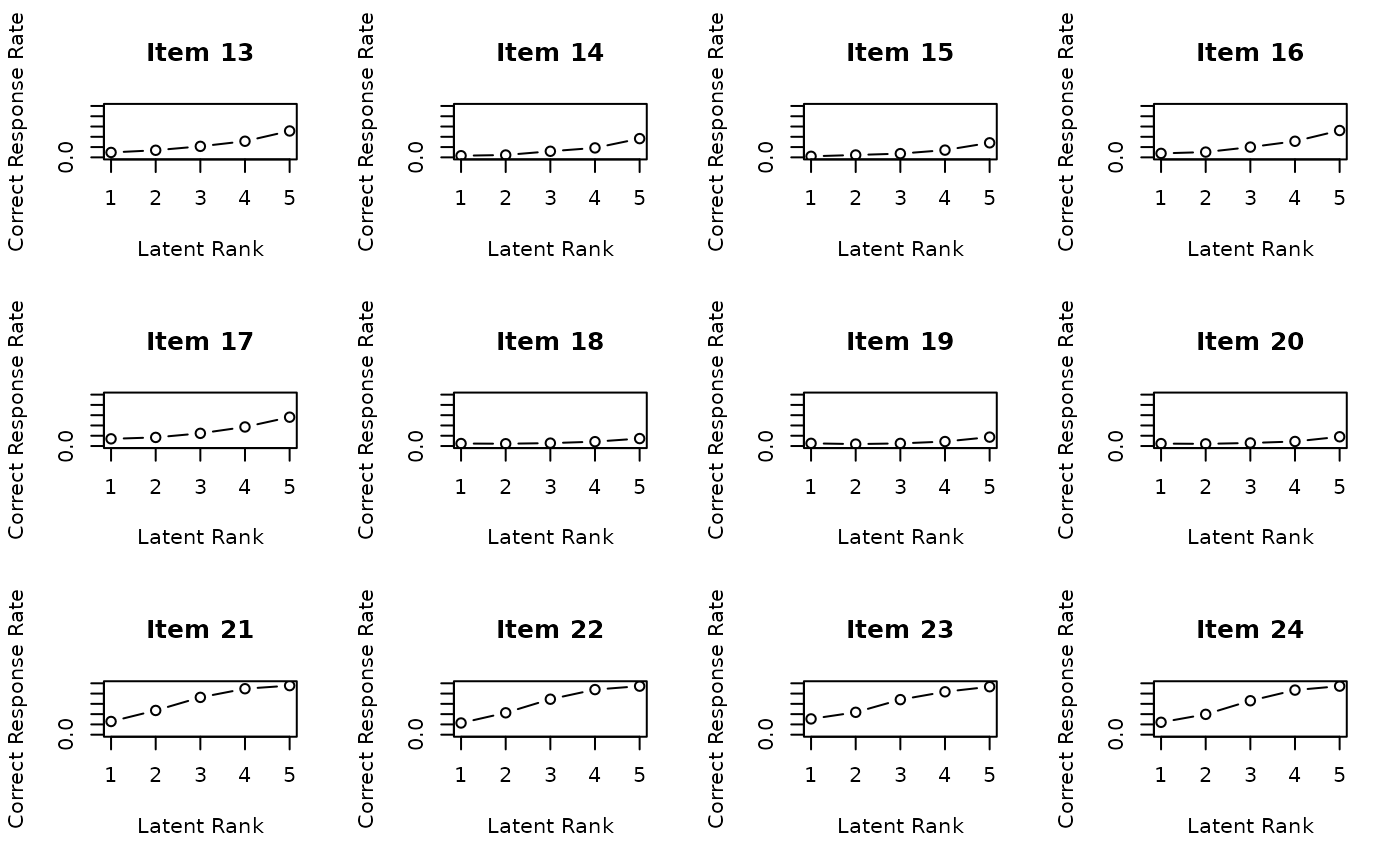
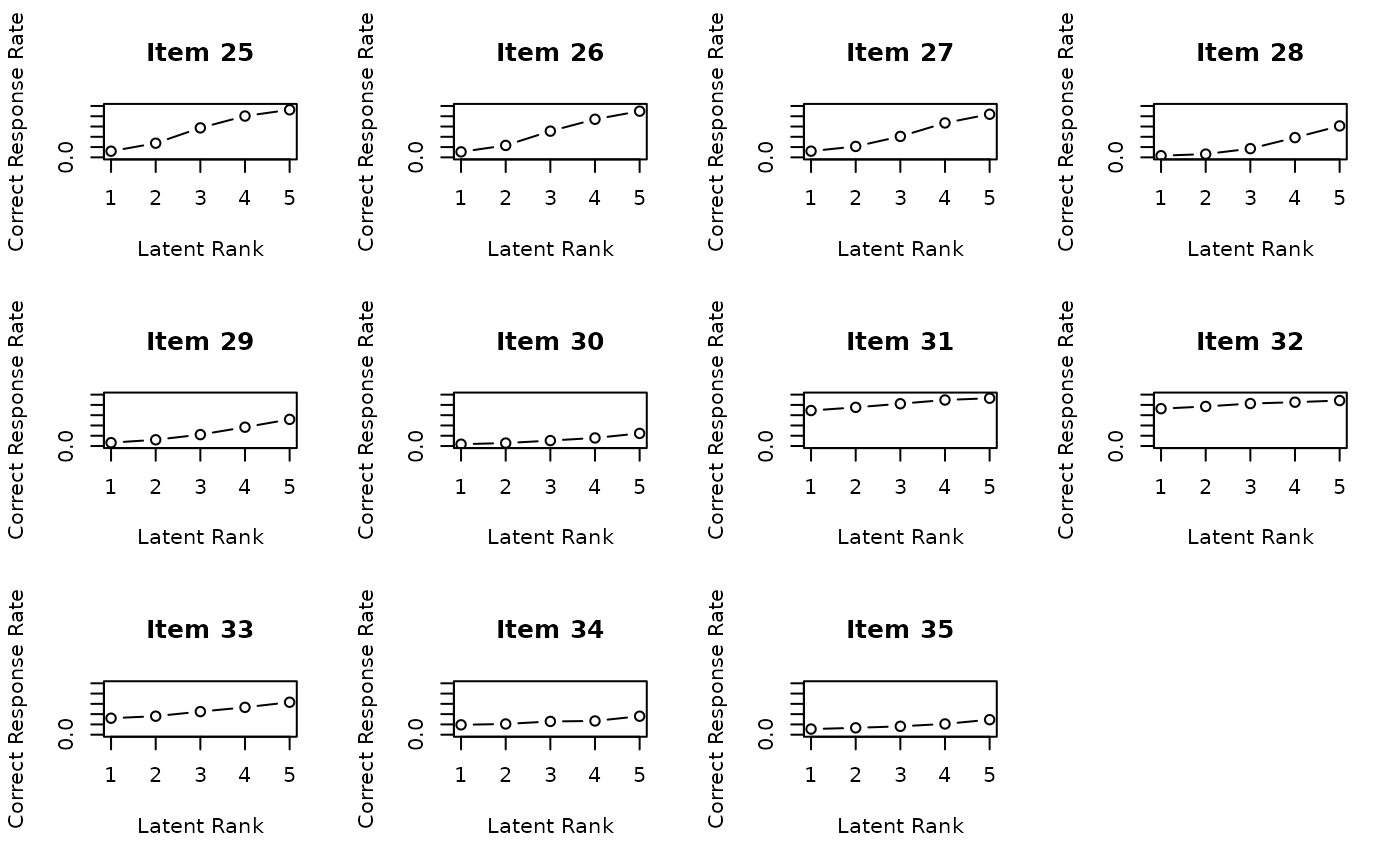
# Plot Item Response Profiles showing item patterns across ranks
plot(result.LDLRA.PBIL, type = "IRP", nc = 4, nr = 3)
 # Plot Test Response Profile showing overall response patterns
plot(result.LDLRA.PBIL, type = "TRP")
# Plot Test Response Profile showing overall response patterns
plot(result.LDLRA.PBIL, type = "TRP")
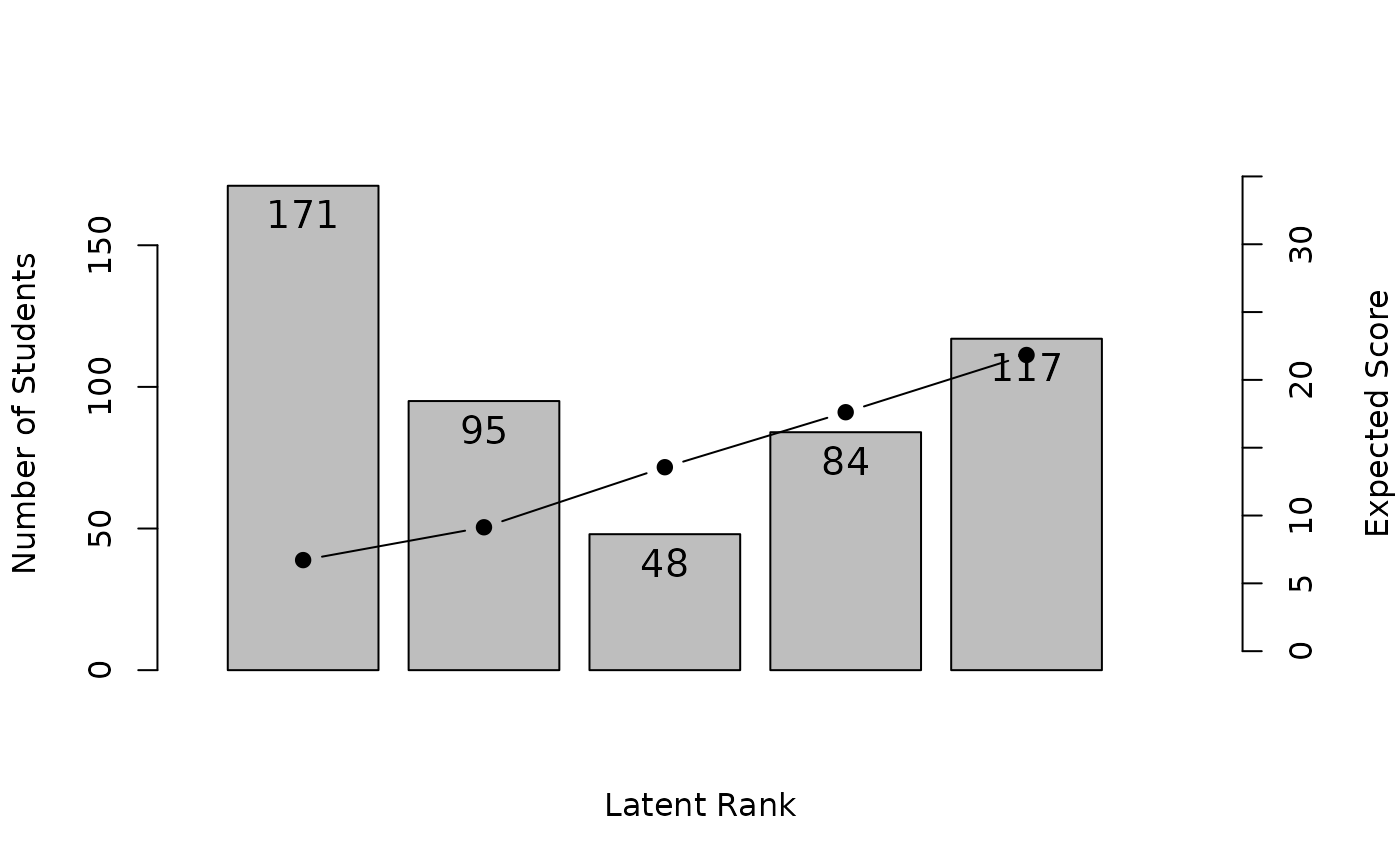
 # Plot Latent Rank Distribution showing student distribution
plot(result.LDLRA.PBIL, type = "LRD")
# Plot Latent Rank Distribution showing student distribution
plot(result.LDLRA.PBIL, type = "LRD")
 # }
# }