Creates visualizations for objects with class "exametrika". The calculation results of the exametrika package have an exametrika class attribute, along with the specific analysis model class (IRT, GRM, LCA, LRA, Biclustering, Biclustering_IRM, LDLRA, LDB, BINET). Each model has its own compatible plot types, accessible by specifying the 'type' parameter.
Usage
# S3 method for class 'exametrika'
plot(
  x,
  type = c("IRF", "TRF", "IIF", "TIF", "IIC", "ICC", "TIC", "IRP", "TRP", "LCD", "CMP",
    "FRP", "RMP", "LRD", "Array", "CRV", "RRV", "FCRP", "FCBR", "ScoreField",
    "FieldPIRP", "LDPSR", "ScoreFreq", "ScoreRank", "ICRP", "ICBR"),
  items = NULL,
  students = NULL,
  nc = 1,
  nr = 1,
  overlay = FALSE,
  colors = NULL,
  cell_width = 3,
  cell_height = 1,
  filename = NULL,
  width = 800,
  height = 600,
  dpi = 300,
  stat = "mean",
  style = "line",
  ...
)
Arguments
- x
An object of class "exametrika"
- type
Character string specifying the plot type. Available types vary by model:
- IRF, ICC
Item Response Function. Also known as 'ICC' (Item Characteristic Curve).
- TRF
Test Response Function.
- IIF, IIC
Item Information Function. Also known as 'IIC' (Item Information Curve).
- TIF, TIC
Test Information Function. Also known as 'TIC' (Test Information Curve).
- IRP
Item Reference Profile. Line graph with items and latent classes/ranks on the horizontal axis, and membership probability on the vertical axis.
- CRV, RRV
Class/Rank Reference Vector. Plots correct answer rates for each class or rank, with fields on the horizontal axis and correct answer rates on the vertical axis.
- TRP
Test Reference Profile. Shows latent classes/ranks on the horizontal axis, displaying members per class/rank as a bar graph and expected test scores as a line graph.
- LCD
Latent Class Distribution. Displays latent classes on the horizontal axis, showing members per class as a bar graph and cumulative membership probability as a line.
- LRD
Latent Rank Distribution. Similar to LCD but with ranks instead of classes on the horizontal axis.
- CMP
Class Membership Profile. Line graph showing class membership probabilities of students.
- RMP
Rank Membership Profile. Similar to CMP but with ranks instead of classes.
- ScoreFreq
Frequency polygon of score distribution with rank thresholds.
- ScoreRank
Heatmap of score membership probabilities for each rank.
- ICRP
Visualizes ranks (x-axis) versus category response probabilities (y-axis).
- ICBR
Visualizes ranks (x-axis) versus cumulative category probabilities (y-axis).
- FRP
Field Reference Profile. Shows correspondence between fields and latent classes/ranks.
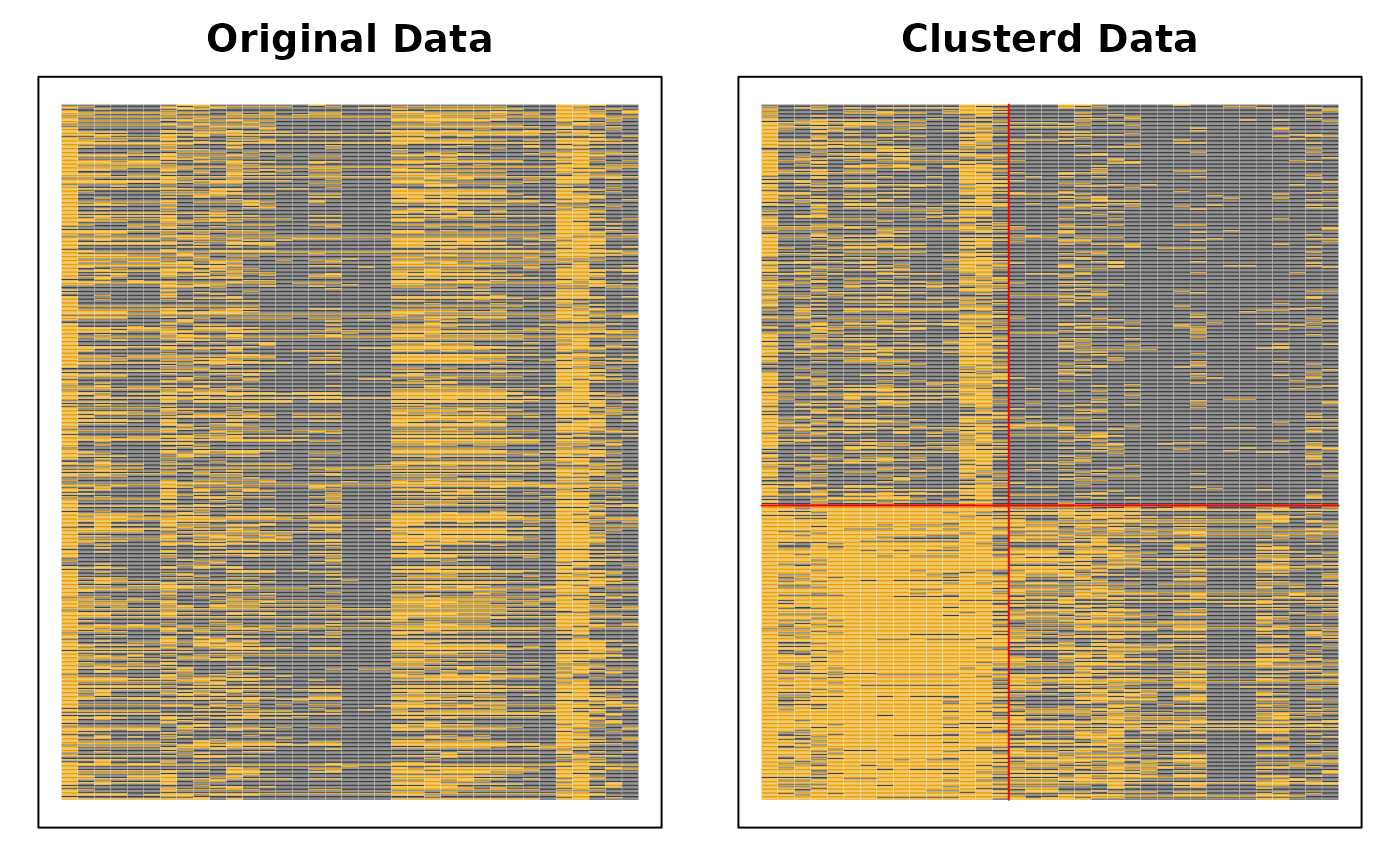
- Array
Array plot for Biclustering/Ranklustering. Colored matrix cells where darker cells indicate larger values.
- FieldPIRP
Shows correct response rates by number of correct answers in parent fields. Only available for LDB model.
- LDPSR
Latent Dependence Passing Student Rate. Compares passing rates of parent and child classes.
- FCRP
Field Category Response Profile. Category probability plot per field for polytomous Biclustering. Use
styleparameter to choose between "line" and "bar" display.- FCBR
Field Cumulative Boundary Reference. Boundary probability plot per field (ordinal Biclustering only).
- ScoreField
Heatmap of expected scores across fields and latent classes/ranks for polytomous Biclustering.
- items
Numeric vector specifying which items to plot. If NULL, all items are included. When type is "IIF"/"IIC", specifying 0 will produce a TIF/TIC for the entire test.
- students
Numeric vector specifying which students to plot. If NULL, all students are included.
- nc
Integer specifying the number of columns for multiple plots. Default is 1.
- nr
Integer specifying the number of rows for multiple plots. Default is 1.
- overlay
Logical. If TRUE, elements such as IRFs will be overlaid on a single plot. Default is FALSE.
- colors
Character vector specifying custom color palette. If NULL, default colorblind-friendly palette is used. For array plots, the first color should be for missing values, followed by response category colors.
- cell_width
Numeric value specifying the width of each cell in array plots. Default is 3.
- cell_height
Numeric value specifying the height of each cell in array plots. Default is 1.
- filename
Character string specifying output filename. If NULL, plot is displayed on screen. Supported formats: png, pdf, jpeg, jpg. Format determined by file extension.
- width
Numeric value specifying plot width in pixels (for png/jpeg) or inches (for pdf). Default is 800.
- height
Numeric value specifying plot height in pixels (for png/jpeg) or inches (for pdf). Default is 600.
- dpi
Numeric value specifying resolution in dots per inch for raster formats (png/jpeg). Default is 300.
- stat
Character string specifying the summary statistic for polytomous FRP and RRV plots. One of "mean" (default), "median", or "mode".
- style
Character string specifying the display style for FCRP plots. One of "line" (default) or "bar" (stacked bar chart).
- ...
Additional graphical parameters passed to the underlying base R plotting functions. Standard parameters such as
pch,las,cex,col,lty, andlwdare forwarded consistently to all plot types (including manually drawn axes), so they can be used to customise point symbols, axis-label orientation, text sizes, and other graphical elements. User-supplied values take precedence over the package defaults (e.g.xlab,ylab,maincan be overridden).
Value
Produces visualizations based on the model class and specified type:
- IRT models
IRF (Item Response Function), TRF (Test Response Function), IIF (Item Information Function), TIF (Test Information Function)
- LCA/LRA models
IRP (Item Reference Profile), TRP (Test Reference Profile), LCD/LRD (Latent Class/Rank Distribution), CMP/RMP (Class/Rank Membership Profile)
- Biclustering/Biclustering_IRM models
Array plots showing clustering patterns, FRP, TRP, etc.
- LDLRA/LDB/BINET models
Network and profile plots specific to each model
Details
Each model class supports specific plot types:
- IRT
Supports "IRF"/"ICC", "TRF", "IIF"/"IIC", "TIF"/"TIC"
- GRM
Supports "IRF"/"ICC", "IIF"/"IIC", "TIF"/"TIC"
- LCA
Supports "IRP", "FRP", "TRP", "LCD", "CMP"
- LRA
Supports "IRP", "FRP", "TRP", "LRD", "RMP"
- LRAordinal
Supports "ScoreFreq", "ScoreRank", "ICRP", "ICBR", "RMP"
- LRArated
Supports "ScoreFreq", "ScoreRank", "ICRP", "RMP"
- Biclustering
Supports "FRP", "TRP", "LCD", "LRD", "CMP", "RMP", "CRV", "RRV", "Array"
- ordinalBiclustering
Supports "FRP", "FCRP", "FCBR", "LCD", "LRD", "CMP", "RMP", "Array", "ScoreField", "RRV"
- nominalBiclustering
Supports "FRP", "FCRP", "LCD", "LRD", "CMP", "Array", "ScoreField", "RRV"
- Biclustering_IRM
Supports "FRP", "TRP", "Array"
- LDLRA
Supports "IRP", "TRP", "LRD", "RMP"
- LDB
Supports "FRP", "TRP", "LRD", "RMP", "Array", "FieldPIRP"
- BINET
Supports "FRP", "TRP", "LRD", "RMP", "Array", "LDPSR"
Examples
if (FALSE) { # \dontrun{
# IRT model example
irt_result <- exametrika::IRT(J15S500)
plot(irt_result, type = "IRF", items = 1:5)
plot(irt_result, type = "TIF")

# LCA model example
lca_result <- exametrika::LCA(U)
plot(lca_result, type = "IRP")
plot(lca_result, type = "LCD")
} # }

# Array plot with custom output
biclustering_result <- exametrika::Biclustering(J35S515)
# Custom colors and file output
my_colors <- c("#404040", "#E69F00", "#56B4E9", "#009E73", "#F0E442")
plot(biclustering_result, type = "Array", colors = my_colors)