Display Multiple Plots Simultaneously from ggExametrika Output
Source:R/option.R
combinePlots_gg.RdThis function arranges multiple ggplot objects from ggExametrika functions into a single display using a grid layout. Useful for comparing plots across items or students.
Usage
combinePlots_gg(plots, selectPlots = c(1:6))Arguments
- plots
A list of ggplot objects, typically output from functions like
plotICC_gg,plotIRP_gg, etc.- selectPlots
A numeric vector specifying which plots to display. Default is
1:6(first 6 plots). Indices exceeding the list length are automatically excluded.
Details
This function uses gridExtra::grid.arrange to combine multiple
plots. The number of rows and columns is automatically determined.
For more control over layout, consider using gridExtra::grid.arrange
directly with the nrow and ncol arguments.
Examples
library(exametrika)
#>
#> Attaching package: ‘exametrika’
#> The following objects are masked from ‘package:ggExametrika’:
#>
#> ItemInformationFunc, LogisticModel
result <- IRT(J15S500, model = 3)
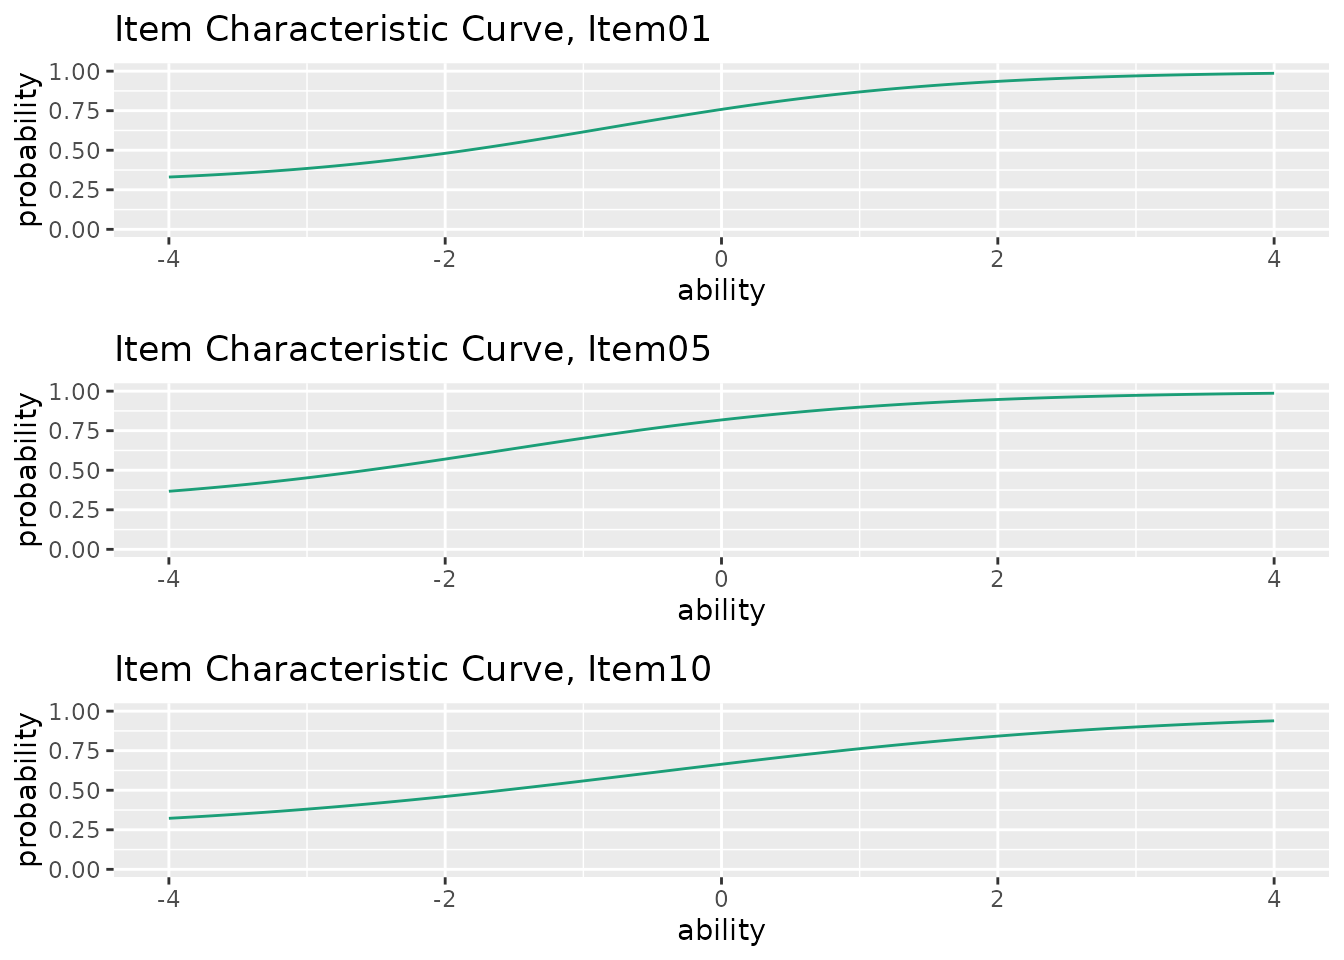
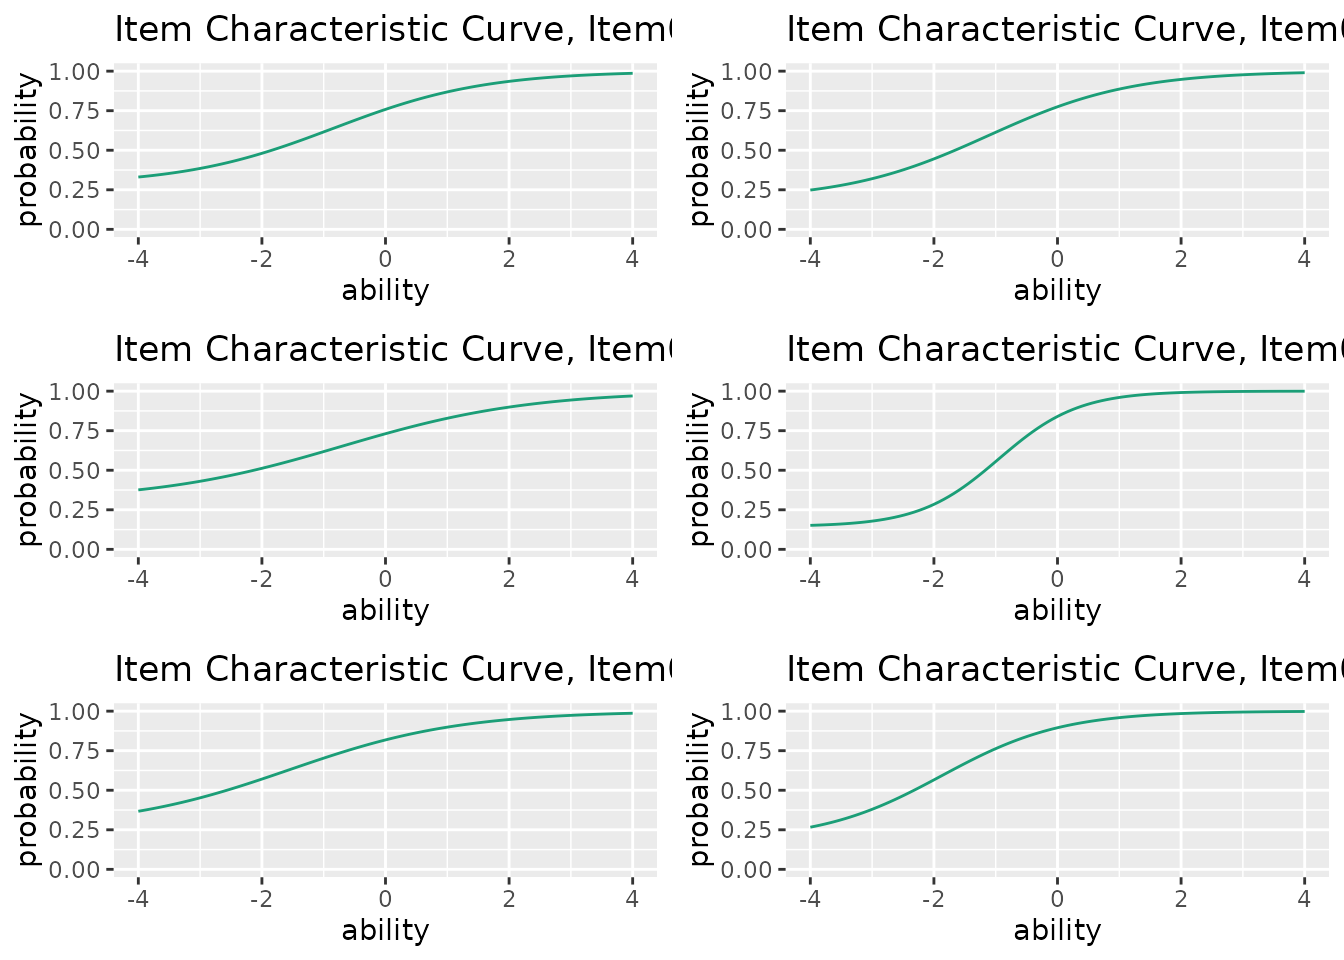
plots <- plotICC_gg(result)
combinePlots_gg(plots, selectPlots = 1:6) # Show first 6 items
 combinePlots_gg(plots, selectPlots = c(1, 5, 10)) # Show specific items