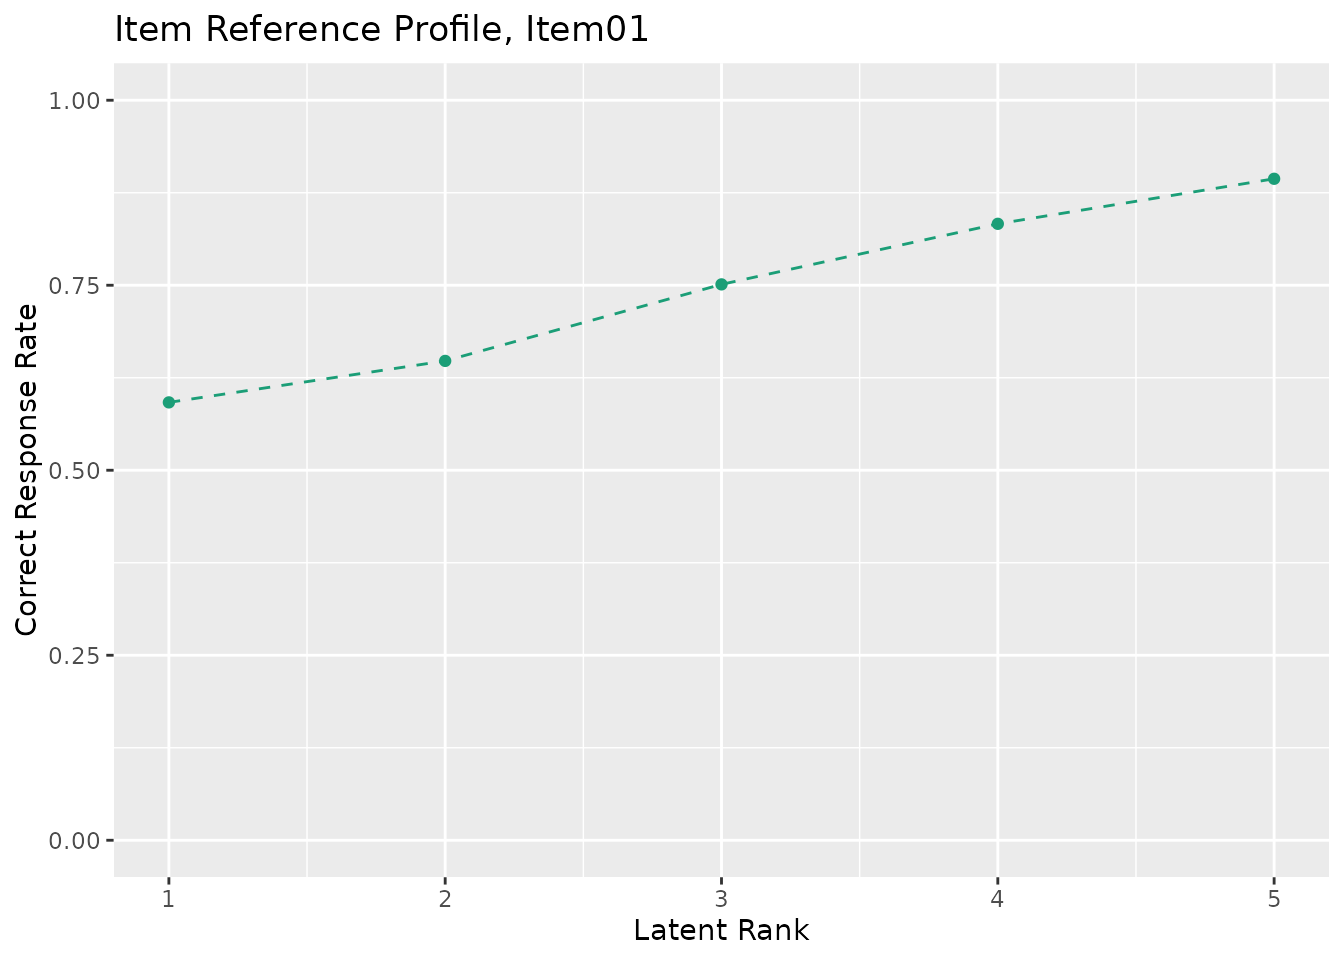
This function takes exametrika output as input and generates Item Reference Profile (IRP) plots using ggplot2. IRP shows the probability of a correct response for each item at each latent class or rank level.
Usage
plotIRP_gg(
  data,
  title = TRUE,
  colors = NULL,
  linetype = "dashed",
  show_legend = FALSE,
  legend_position = "right"
)
Arguments
- data
An object of class
c("exametrika", "LCA"),c("exametrika", "LRA"), orc("exametrika", "LDLRA").- title
Logical or character. If
TRUE(default), display an auto-generated title. IfFALSE, no title. If a character string, use it as a custom title (only for single-item plots).- colors
Character vector. Color(s) for points and lines. If
NULL(default), a colorblind-friendly palette is used.- linetype
Character or numeric specifying the line type. Default is
"dashed".- show_legend
Logical. If
TRUE, display the legend. Default isFALSE.- legend_position
Character. Position of the legend. One of
"right"(default),"top","bottom","left","none".
Value
A list of ggplot objects, one for each item. Each plot shows the correct response rate across latent classes or ranks.
Details
The Item Reference Profile visualizes how item difficulty varies across latent classes (LCA) or ranks (LRA, LDLRA). Items with monotonically increasing profiles indicate good discrimination between classes/ranks.
Examples
library(exametrika)
result <- LRA(J15S500, nrank = 5)
plots <- plotIRP_gg(result)
plots[[1]] # Show IRP for the first item