This function takes exametrika output as input and generates array plots using ggplot2. Array plots visualize the response patterns of students (rows) across items (columns), showing both the original data and the clustered/reordered data.
Supports both binary (0/1) and multi-valued (ordinal/nominal) data.
Usage
plotArray_gg(
  data,
  Original = TRUE,
  Clustered = TRUE,
  Clustered_lines = TRUE,
  Clustered_lines_color = NULL,
  title = TRUE,
  colors = NULL,
  show_legend = NULL,
  legend_position = "right",
  border = FALSE,
  border_linewidth = 0.5
)
Arguments
- data
An object of class
c("exametrika", "Biclustering"),c("exametrika", "nominalBiclustering"),c("exametrika", "ordinalBiclustering"),c("exametrika", "ratedBiclustering"),c("exametrika", "IRM"),c("exametrika", "LDB"), orc("exametrika", "BINET").- Original
Logical. If
TRUE(default), plot the original (unsorted) response data.- Clustered
Logical. If
TRUE(default), plot the clustered (sorted by class and field) response data.- Clustered_lines
Logical. If
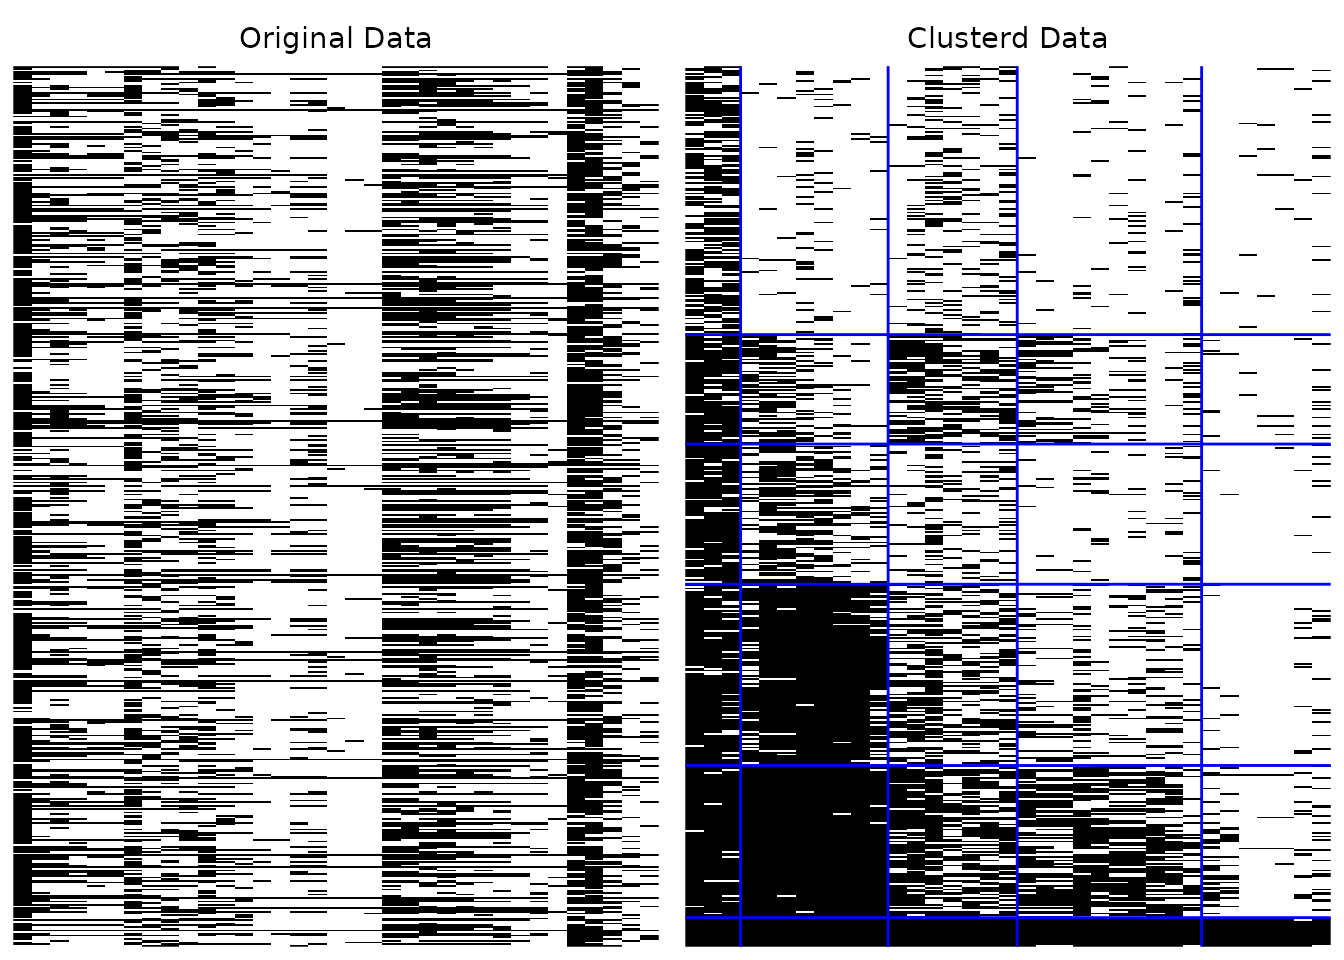
TRUE(default), draw lines on the clustered plot to indicate class and field boundaries.- Clustered_lines_color
Character. Color of the boundary lines. If
NULL(default), uses"red"for binary data or"white"for multi-valued data.- title
Logical or character. If
TRUE(default), display auto-generated titles. IfFALSE, no titles. If a character string, use it as a custom title prefix.- colors
Character vector of colors for each category. If
NULL(default), uses white/black for binary data or a colorblind-friendly palette for multi-valued data.- show_legend
Logical. If
TRUE, display the legend. Default isFALSEfor binary data,TRUEfor multi-valued.- legend_position
Character. Position of the legend. One of
"right"(default),"top","bottom","left","none".- border
Logical or character. If
TRUE, draw a rectangular border around each panel so that the original and clustered panels are visually separated. IfFALSE(default), no border is drawn (the v1.1.0 behavior). A character string is used as the border color (default color is"black").- border_linewidth
Numeric. Line width of the panel border. Default is
0.5.
Value
When both Original and Clustered are TRUE,
a gtable (grid arrangement of the two panels side by side, drawn as a
side effect). Otherwise, a list containing the single requested
ggplot object.
Details
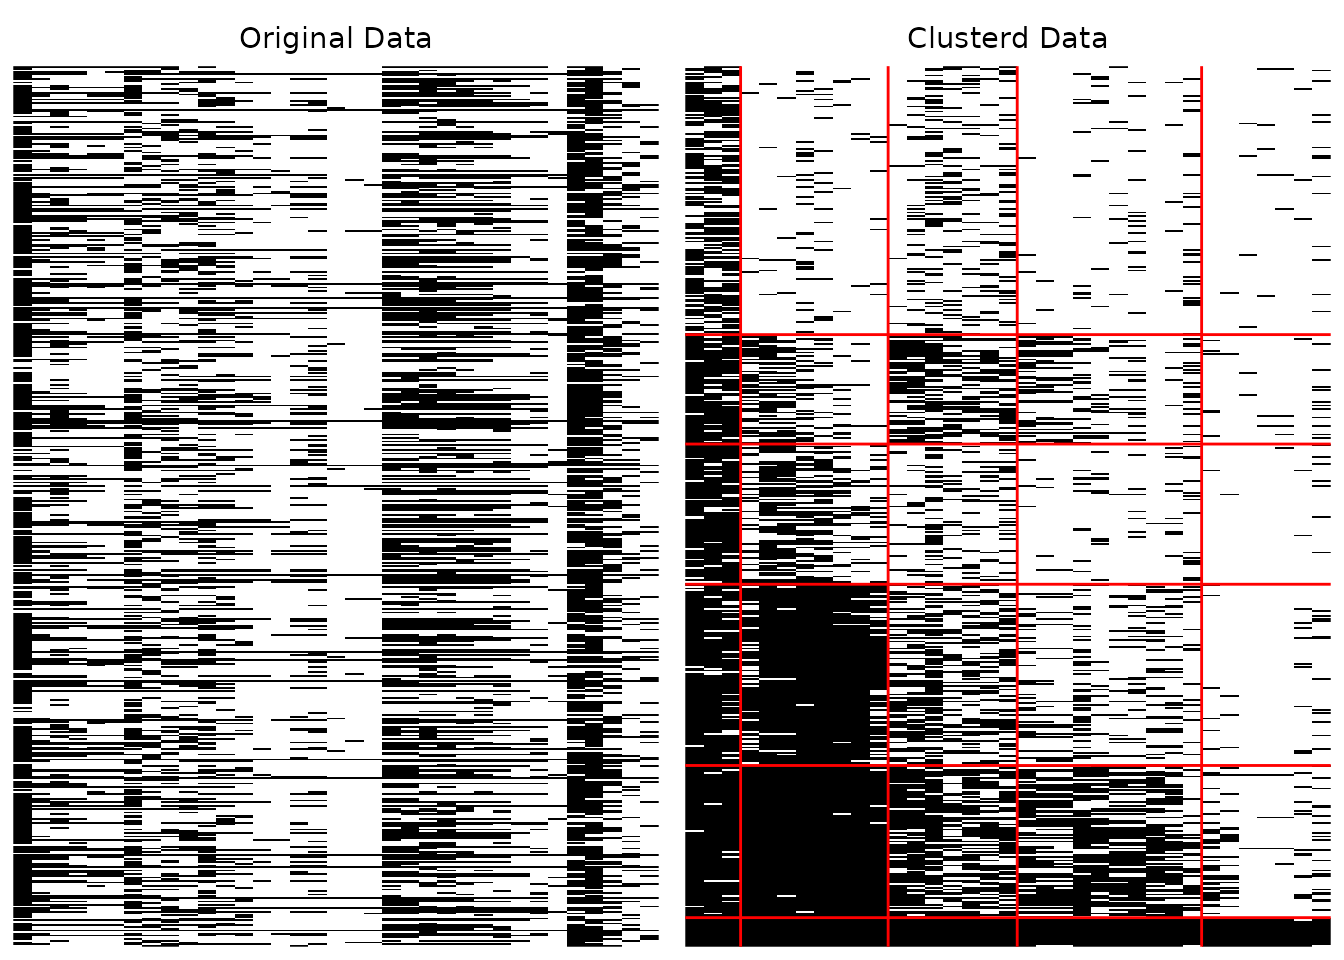
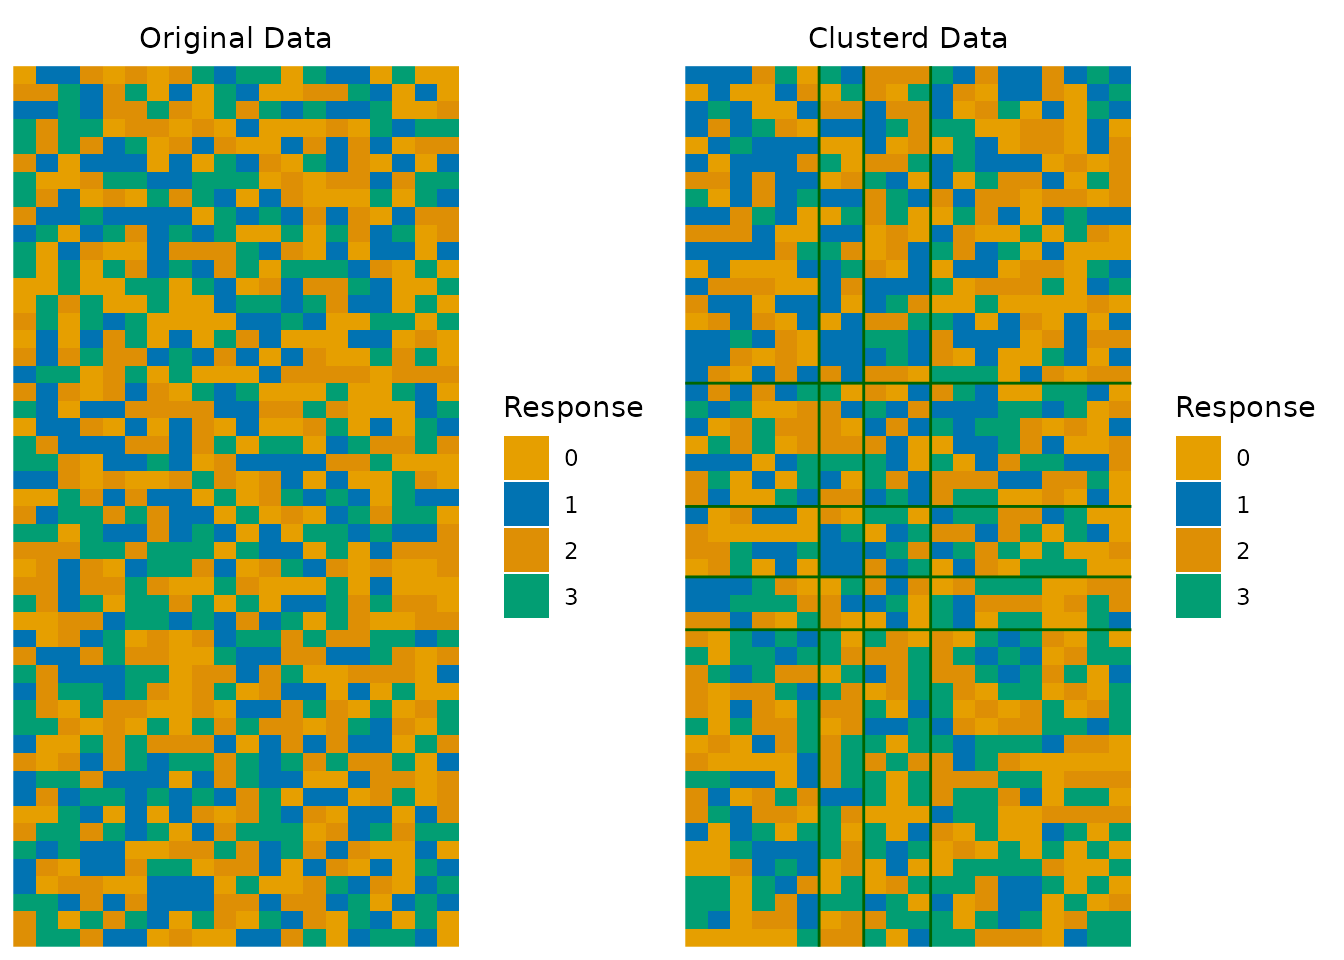
The array plot provides a visual representation of the biclustering result. For binary data, black cells indicate correct responses (1) and white cells indicate incorrect responses (0). For multi-valued data, different colors represent different response categories.
In a well-fitted model, the clustered plot should show a clear block diagonal pattern where high-ability students (bottom rows) answer difficult items (right columns) correctly.
Examples
library(exametrika)
result <- Biclustering(J35S515, nfld = 5, ncls = 6)
# Basic usage
plotArray_gg(result)
 #> TableGrob (1 x 2) "arrange": 2 grobs
#> z cells name grob
#> 1 1 (1-1,1-1) arrange gtable[layout]
#> 2 2 (1-1,2-2) arrange gtable[layout]
# Custom boundary line color
plotArray_gg(result, Clustered_lines_color = "blue")
#> TableGrob (1 x 2) "arrange": 2 grobs
#> z cells name grob
#> 1 1 (1-1,1-1) arrange gtable[layout]
#> 2 2 (1-1,2-2) arrange gtable[layout]
# Custom boundary line color
plotArray_gg(result, Clustered_lines_color = "blue")
 #> TableGrob (1 x 2) "arrange": 2 grobs
#> z cells name grob
#> 1 1 (1-1,1-1) arrange gtable[layout]
#> 2 2 (1-1,2-2) arrange gtable[layout]
# Multi-valued data with custom colors
synthetic_data <- matrix(sample(0:3, 50 * 20, replace = TRUE), nrow = 50, ncol = 20)
result_multi <- Biclustering(synthetic_data, nfld = 4, ncls = 5)
#> No ID column detected. All columns treated as response data. Sequential IDs (Student1, Student2, ...) were generated. Use id= parameter to specify the ID column explicitly.
plotArray_gg(result_multi, show_legend = TRUE, Clustered_lines_color = "darkgreen")
#> TableGrob (1 x 2) "arrange": 2 grobs
#> z cells name grob
#> 1 1 (1-1,1-1) arrange gtable[layout]
#> 2 2 (1-1,2-2) arrange gtable[layout]
# Multi-valued data with custom colors
synthetic_data <- matrix(sample(0:3, 50 * 20, replace = TRUE), nrow = 50, ncol = 20)
result_multi <- Biclustering(synthetic_data, nfld = 4, ncls = 5)
#> No ID column detected. All columns treated as response data. Sequential IDs (Student1, Student2, ...) were generated. Use id= parameter to specify the ID column explicitly.
plotArray_gg(result_multi, show_legend = TRUE, Clustered_lines_color = "darkgreen")
 #> TableGrob (1 x 2) "arrange": 2 grobs
#> z cells name grob
#> 1 1 (1-1,1-1) arrange gtable[layout]
#> 2 2 (1-1,2-2) arrange gtable[layout]
#> TableGrob (1 x 2) "arrange": 2 grobs
#> z cells name grob
#> 1 1 (1-1,1-1) arrange gtable[layout]
#> 2 2 (1-1,2-2) arrange gtable[layout]