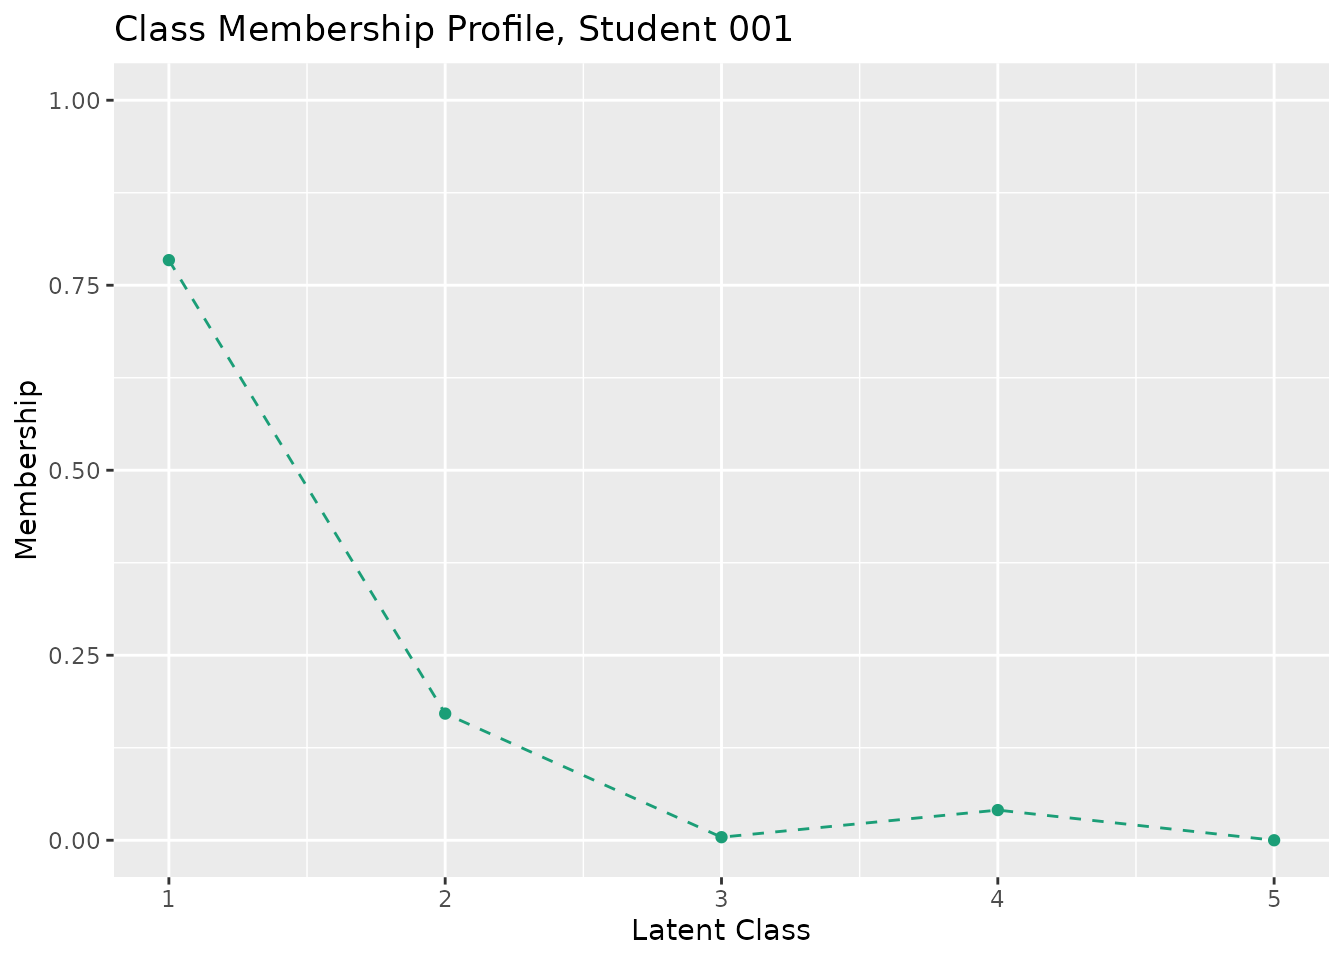
This function takes exametrika output as input and generates Class Membership Profile (CMP) plots using ggplot2. CMP shows each student's membership probability across all latent classes.
Usage
plotCMP_gg(
  data,
  title = TRUE,
  colors = NULL,
  linetype = "dashed",
  show_legend = FALSE,
  legend_position = "right"
)
Arguments
- data
An object of class
c("exametrika", "LCA")orc("exametrika", "BINET"). If LRA, Biclustering, LDLRA, or LDB output is provided, RMP will be plotted instead with a warning.- title
Logical or character. If
TRUE(default), display an auto-generated title. IfFALSE, no title. If a character string, use it as a custom title (only for single-student plots).- colors
Character vector. Color(s) for points and lines. If
NULL(default), a colorblind-friendly palette is used.- linetype
Character or numeric specifying the line type. Default is
"dashed".- show_legend
Logical. If
TRUE, display the legend. Default isFALSE.- legend_position
Character. Position of the legend. One of
"right"(default),"top","bottom","left","none".
Value
A list of ggplot objects, one for each student. Each plot shows the membership probability across all latent classes.
Details
The Class Membership Profile visualizes how strongly each student belongs to each latent class. Students with high membership probability in a single class are well-classified, while students with similar probabilities across classes may be ambiguous cases.
Examples
library(exametrika)
# \donttest{
result <- LCA(J15S500, ncls = 5)
plots <- plotCMP_gg(result)
plots[[1]] # Show CMP for the first student
 # }
# }