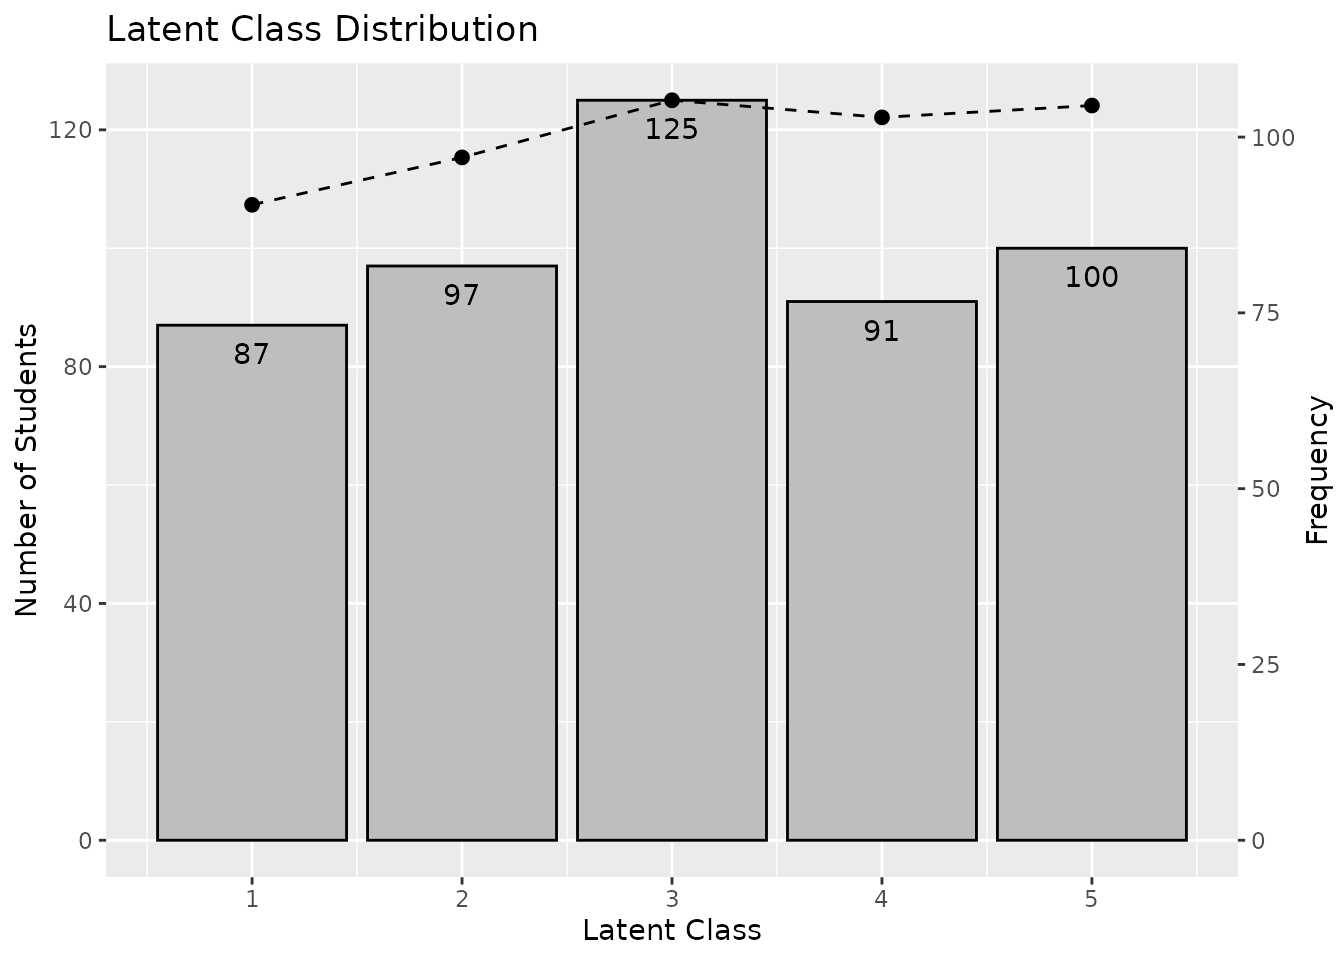
This function takes exametrika output as input and generates a Latent Class Distribution (LCD) plot using ggplot2. LCD shows the number of students in each latent class and the class membership distribution.
Usage
plotLCD_gg(
  data,
  Num_Students = TRUE,
  title = TRUE,
  colors = NULL,
  linetype = "dashed",
  show_legend = FALSE,
  legend_position = "right"
)
Arguments
- data
An object of class
c("exametrika", "LCA")orc("exametrika", "BINET"). If LRA or Biclustering output is provided, LRD will be plotted instead with a warning.- Num_Students
Logical. If
TRUE(default), display the number of students on each bar.- title
Logical or character. If
TRUE(default), display the auto-generated title. IfFALSE, no title. If a character string, use it as a custom title.- colors
Character vector of length 2. First element is the bar fill color, second is the line/point color. If
NULL(default), uses gray for bars and black for line/points.- linetype
Character or numeric specifying the line type for the frequency line. Default is
"dashed".- show_legend
Logical. If
TRUE, display the legend. Default isFALSE.- legend_position
Character. Position of the legend. One of
"right"(default),"top","bottom","left","none".
Value
A single ggplot object with dual y-axes showing both the student count and membership frequency.
Details
The Latent Class Distribution shows how students are distributed across latent classes. The bar graph shows the number of students assigned to each class, and the line graph shows the cumulative class membership distribution.
Examples
library(exametrika)
result <- LCA(J15S500, ncls = 5)
plot <- plotLCD_gg(result)
plot