Plot Field PIRP (Parent Item Reference Profile) from exametrika
Source:R/arraytoLDPSR.R
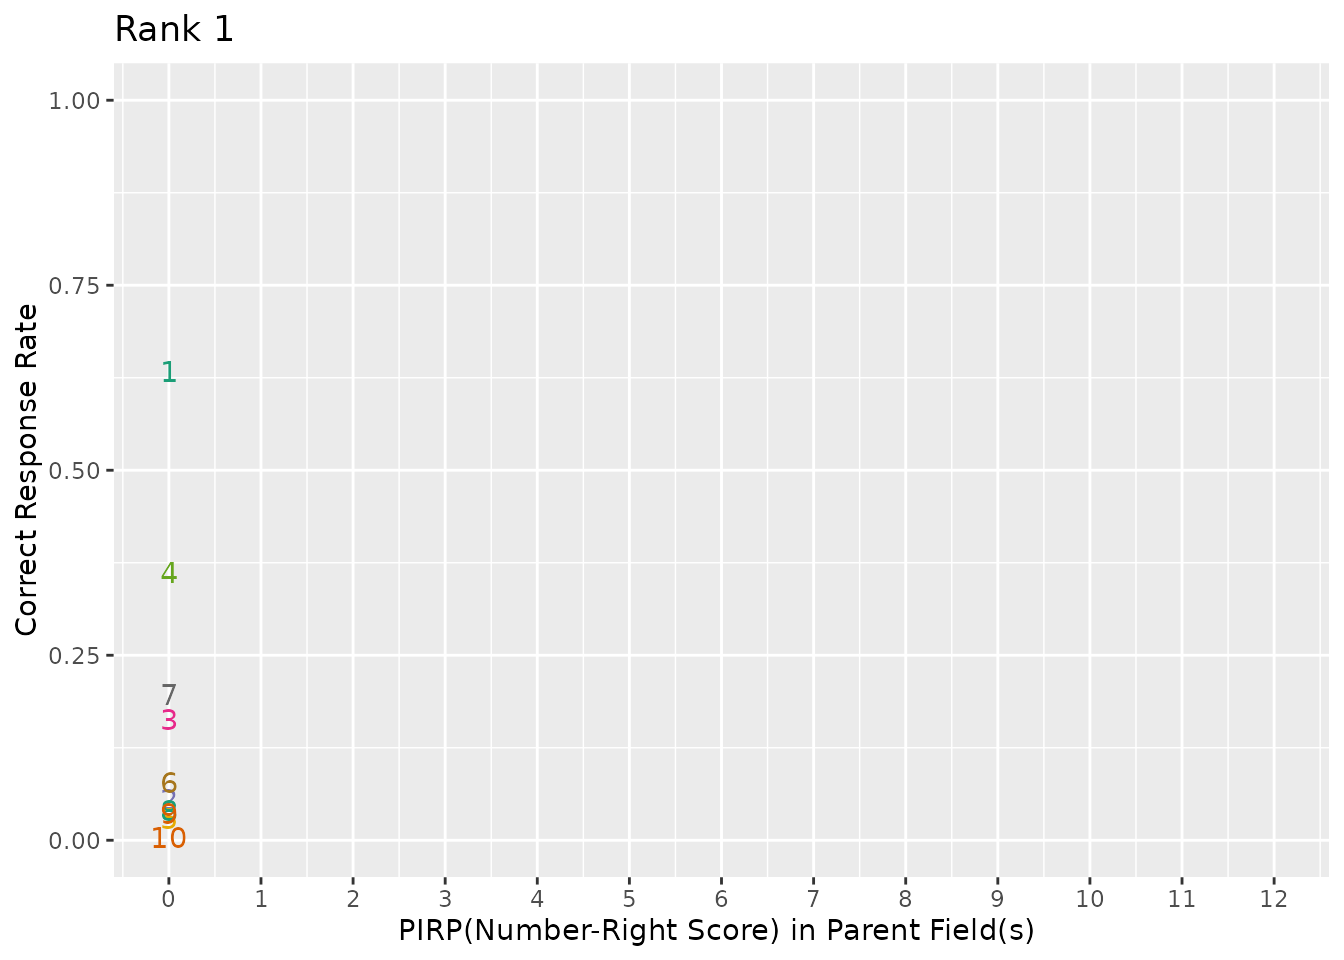
plotFieldPIRP_gg.RdThis function takes exametrika LDB output as input and generates Field PIRP (Parent Item Reference Profile) plots using ggplot2. Field PIRP shows the correct response rate for each field as a function of the number-right score in parent fields.
Usage
plotFieldPIRP_gg(
  data,
  title = TRUE,
  colors = NULL,
  linetype = "solid",
  show_legend = FALSE,
  legend_position = "right"
)
Arguments
- data
An object of class
c("exametrika", "LDB").- title
Logical or character. If
TRUE(default), display an auto-generated title. IfFALSE, no title. If a character string, use it as a custom title prefix (rank number will be appended).- colors
Character vector. Colors for each field line. If
NULL(default), uses black for all lines (with text labels for field identification).- linetype
Character or numeric specifying the line type. Default is
"solid".- show_legend
Logical. If
TRUE, display the legend. Default isFALSE(uses text labels instead).- legend_position
Character. Position of the legend. One of
"right"(default),"top","bottom","left","none".
Value
A list of ggplot objects, one for each rank. Each plot shows the correct response rate curves for all fields at that rank level.
Details
In Local Dependence Biclustering (LDB), items in a field may depend on performance in parent fields. The Field PIRP visualizes this dependency by showing how the correct response rate in each field changes based on the number of correct responses in parent fields.
Note: Warning messages about NA values may appear during plotting but the behavior is normal.
Examples
# \donttest{
library(exametrika)
# LDB requires field configuration and edge structure
conf <- c(
  1, 6, 6, 8, 9, 9, 4, 7, 7, 7, 5, 8, 9, 10, 10, 9, 9,
  10, 10, 10, 2, 2, 3, 3, 5, 5, 6, 9, 9, 10, 1, 1, 7, 9, 10
)
edges_data <- data.frame(
  "From Field (Parent) >>>" = c(6, 4, 5, 1, 1, 4, 3, 4, 6, 2, 4, 4, 3, 6, 4, 1, 7, 9, 6, 7),
  ">>> To Field (Child)" = c(8, 7, 8, 7, 2, 5, 5, 8, 8, 4, 6, 7, 5, 8, 5, 8, 10, 10, 8, 9),
  "At Class/Rank (Locus)" = c(2, 2, 2, 2, 2, 2, 3, 3, 3, 3, 3, 3, 4, 4, 4, 4, 5, 5, 5, 5)
)
tmp_file <- tempfile(fileext = ".csv")
write.csv(edges_data, file = tmp_file, row.names = FALSE)
result <- LDB(J35S515, ncls = 5, conf = conf, adj_file = tmp_file)
unlink(tmp_file)
plots <- plotFieldPIRP_gg(result)
plots[[1]] # Show Field PIRP for rank 1
#> Warning: Removed 120 rows containing missing values or values outside the scale range
#> (`geom_line()`).
#> `geom_line()`: Each group consists of only one observation.
#> ℹ Do you need to adjust the group aesthetic?
#> Warning: Removed 120 rows containing missing values or values outside the scale range
#> (`geom_text()`).

# }
# }