This function takes exametrika GRM output as input and generates Item Category Response Function (ICRF) plots using ggplot2. Each plot shows the probability of selecting each response category as a function of ability (theta).
Usage
plotICRF_gg(
  data,
  items = NULL,
  xvariable = c(-4, 4),
  title = TRUE,
  colors = NULL,
  linetype = "solid",
  show_legend = TRUE,
  legend_position = "right"
)
Arguments
- data
An object of class
c("exametrika", "GRM")fromexametrika::GRM().- items
Numeric vector specifying which items to plot. If
NULL(default), all items are plotted.- xvariable
A numeric vector of length 2 specifying the range of the x-axis (ability). Default is
c(-4, 4).- title
Logical or character. If
TRUE(default), display an auto-generated title. IfFALSE, no title. If a character string, use it as a custom title applied to every item's plot.- colors
Character vector of colors for each category. If
NULL(default), a colorblind-friendly palette is used.- linetype
Character or numeric specifying the line type. Default is
"solid".- show_legend
Logical. If
TRUE(default), display the legend.- legend_position
Character. Position of the legend. One of
"right"(default),"top","bottom","left","none".
Value
A list of ggplot objects, one for each item. Each plot shows the Item Category Response Function for that item.
Details
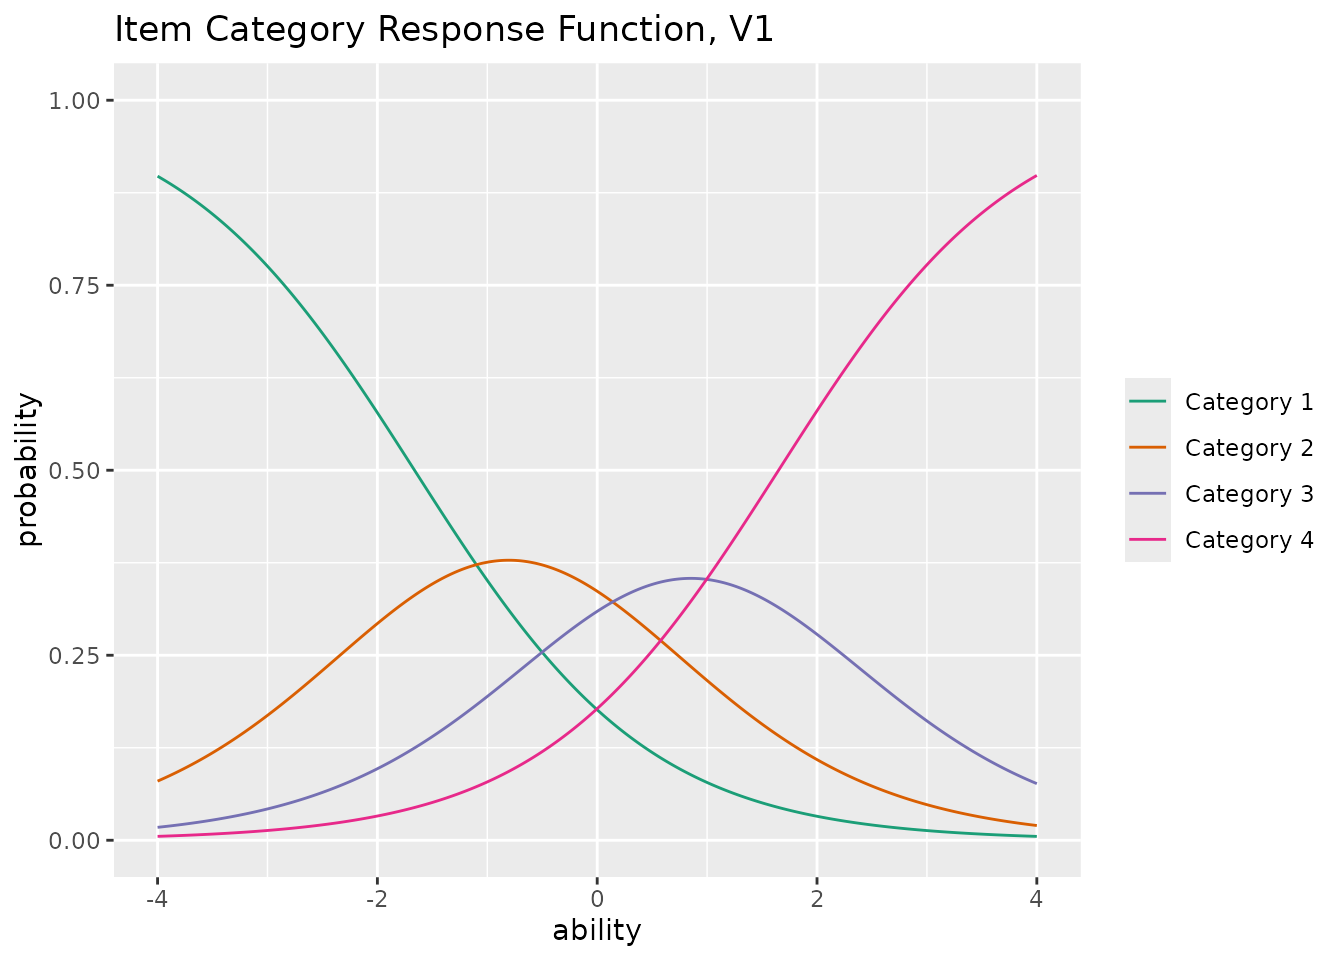
The Graded Response Model (GRM) estimates the probability of selecting each ordered response category. For an item with \(K\) categories, the ICRF shows \(K\) curves, one for each category. At any given ability level, the probabilities across all categories sum to 1.
The category probabilities are derived from cumulative probabilities: $$P_k^*(\theta) = \frac{1}{1 + \exp(-a(\theta - b_k))}$$ $$P_k(\theta) = P_k^*(\theta) - P_{k+1}^*(\theta)$$
Examples
library(exametrika)
# \donttest{
result <- GRM(J5S1000)
plots <- plotICRF_gg(result)
plots[[1]] # Show ICRF for the first item
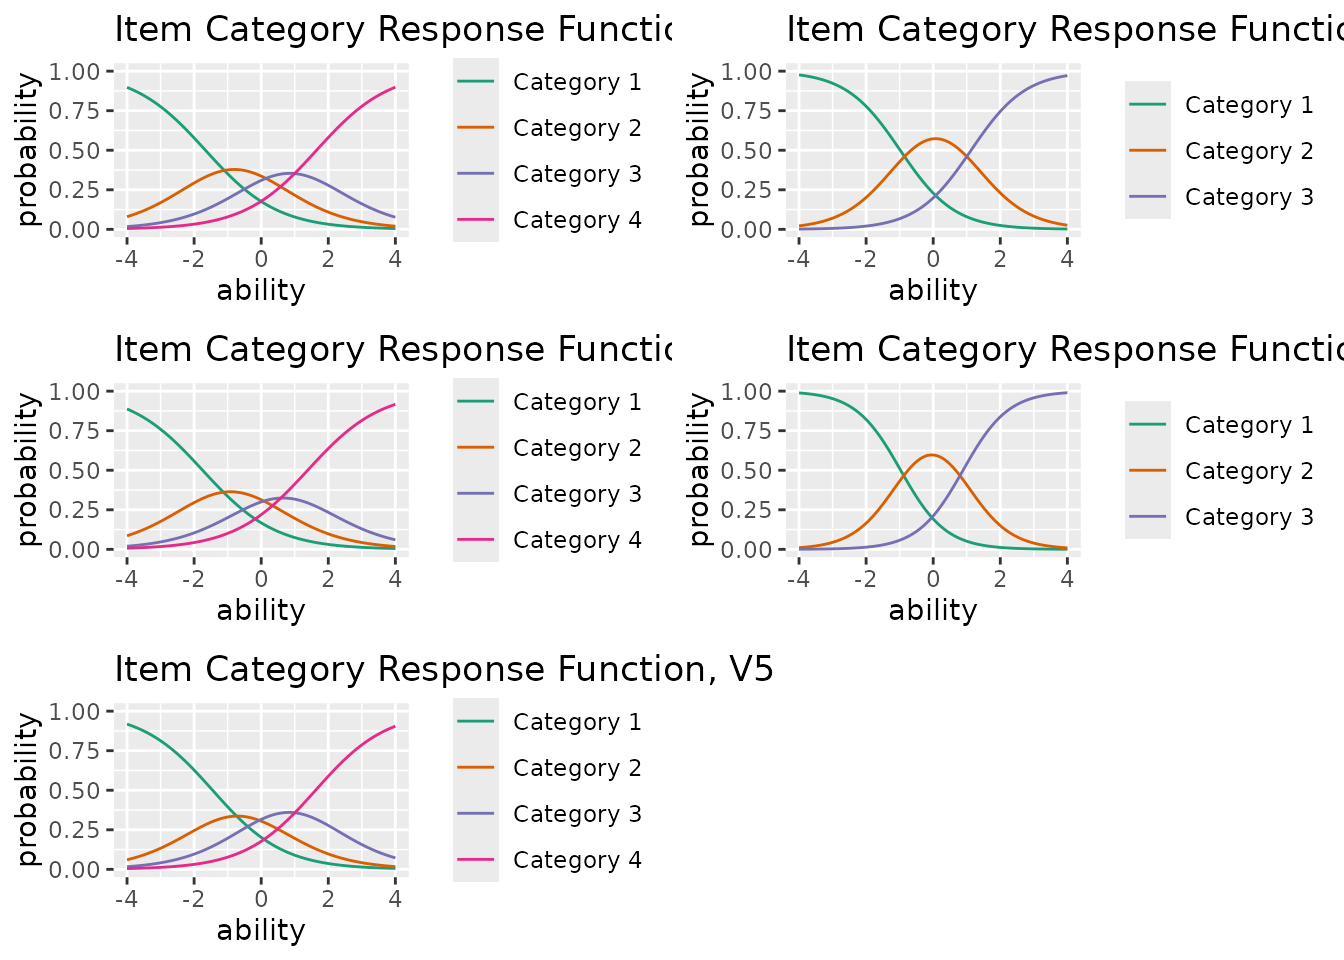
 combinePlots_gg(plots, selectPlots = 1:5)
 # }
# }