Plot All Item Information Curves Overlaid from exametrika
Source:R/ICCtoTIC.R
plotIIC_overlay_gg.RdThis function takes exametrika IRT or GRM output as input and generates an overlay plot of all Item Information Curves (IIC) using ggplot2. All item curves are displayed on a single graph for easy comparison.
Usage
plotIIC_overlay_gg(
  data,
  items = NULL,
  xvariable = c(-4, 4),
  title = TRUE,
  colors = NULL,
  linetype = "solid",
  show_legend = TRUE,
  legend_position = "right"
)
Arguments
- data
An object of class
c("exametrika", "IRT")fromexametrika::IRT()orc("exametrika", "GRM")fromexametrika::GRM().- items
Numeric vector specifying which items to plot. If
NULL(default), all items are plotted.- xvariable
A numeric vector of length 2 specifying the range of the x-axis (ability). Default is
c(-4, 4).- title
Logical or character. If
TRUE(default), display an auto-generated title. IfFALSE, no title. If a character string, use it as a custom title.- colors
Character vector of colors for each item. If
NULL(default), a colorblind-friendly palette is used.- linetype
Character or numeric specifying the line type. Can be a single value for all items or a vector for each item. Default is
"solid".- show_legend
Logical. If
TRUE(default), display the legend.- legend_position
Character. Position of the legend. One of
"right"(default),"top","bottom","left","none".
Details
This function is similar to calling plot(IRT_result, type = "IIF", overlay = TRUE)
or plot(GRM_result, type = "IIF", overlay = TRUE) in the exametrika package,
but returns a ggplot2 object that can be further customized.
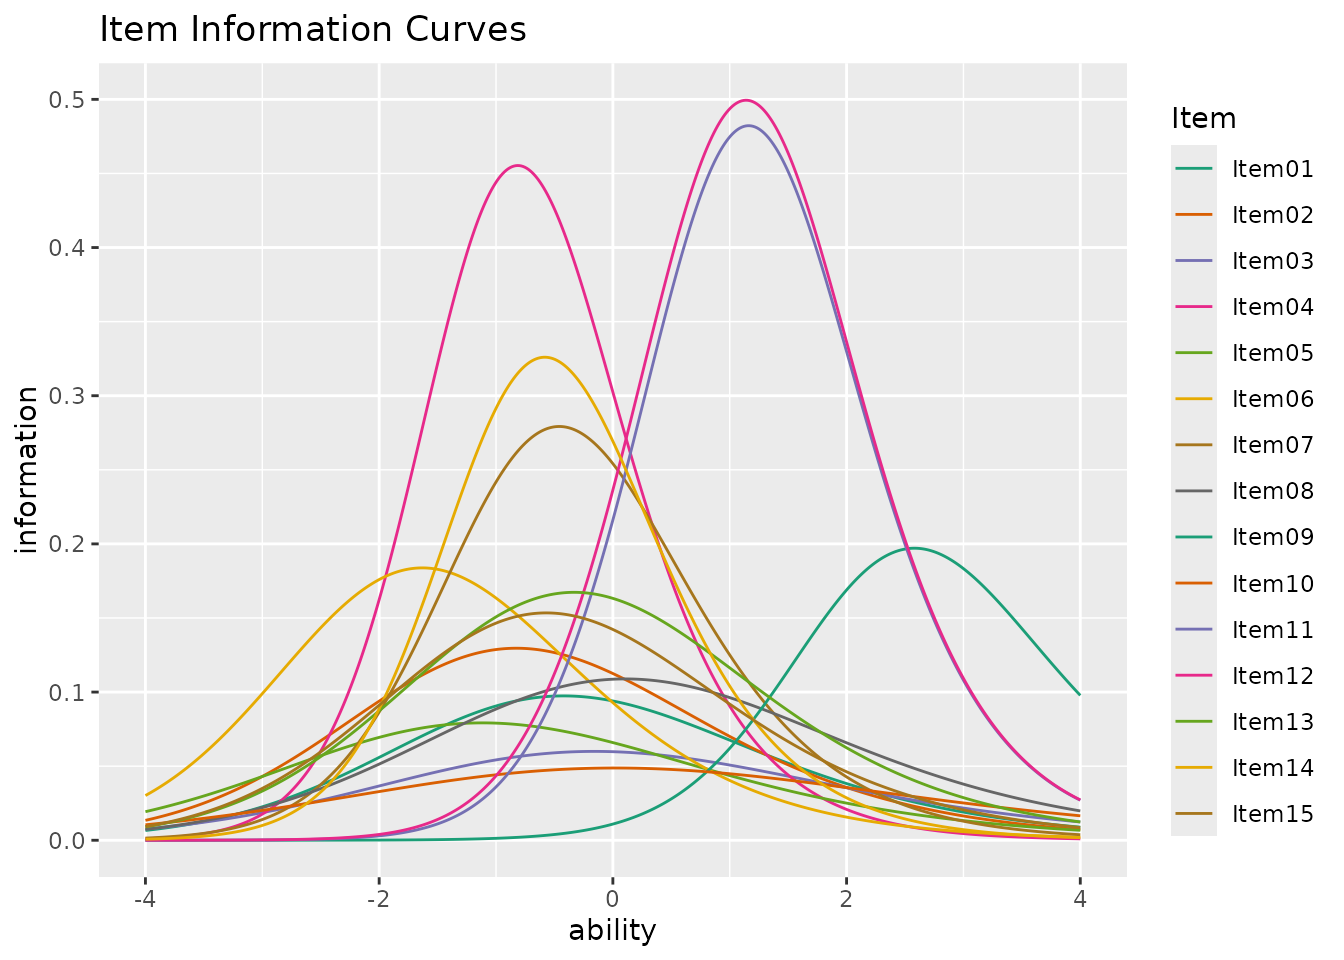
The Item Information Function indicates how precisely an item measures ability at each point on the theta scale. Items with higher discrimination parameters provide more information. The peak of the information curve occurs near the item's difficulty parameter.
Examples
library(exametrika)
# \donttest{
# IRT example
result_irt <- IRT(J15S500, model = 3)
plotIIC_overlay_gg(result_irt) # All items
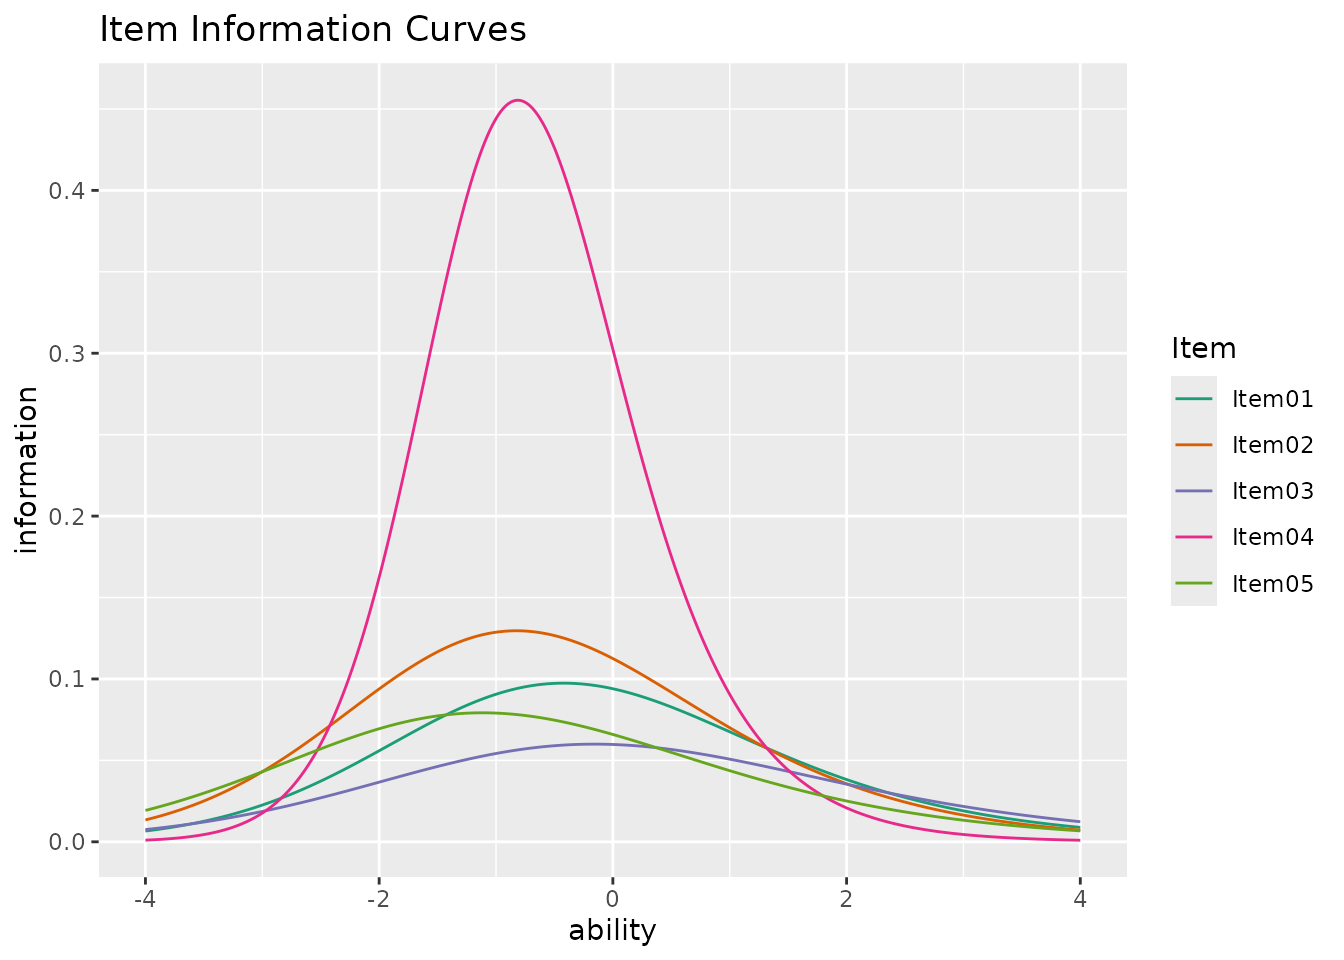
 plotIIC_overlay_gg(result_irt, items = 1:5) # First 5 items only
 # GRM example
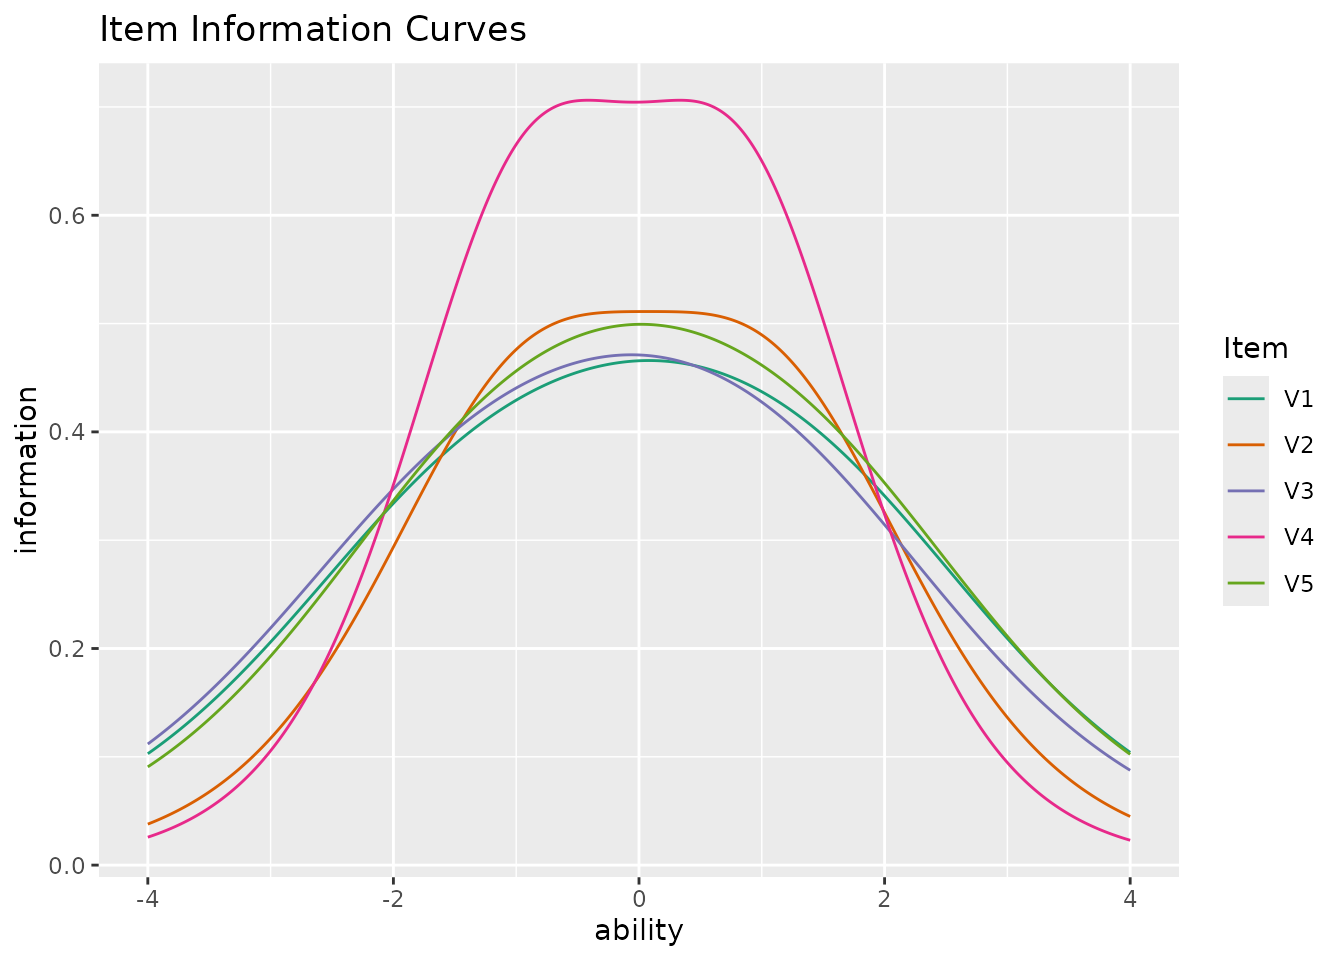
result_grm <- GRM(J5S1000)
plotIIC_overlay_gg(result_grm, show_legend = TRUE)
# GRM example
result_grm <- GRM(J5S1000)
plotIIC_overlay_gg(result_grm, show_legend = TRUE)
 # }
# }