Plot Field Category Response Profile (FCRP) for Polytomous Biclustering
Source:R/PolyBiclustering.R
plotFCRP_gg.RdCreates a Field Category Response Profile (FCRP) plot for polytomous (ordinal or nominal) Biclustering results. FCRP displays the probability of each response category for each latent class/rank within each field.
Usage
plotFCRP_gg(
  data,
  style = c("line", "bar"),
  title = TRUE,
  colors = NULL,
  linetype = NULL,
  show_legend = TRUE,
  legend_position = "right"
)
Arguments
- data
An object of class
c("exametrika", "ordinalBiclustering"),c("exametrika", "nominalBiclustering"), orc("exametrika", "ratedBiclustering")fromexametrika::Biclustering().- style
Character string specifying the plot style. One of:
"line"Line plot with points (default)
"bar"Stacked bar chart
- title
Logical or character. If
TRUE(default), displays an auto-generated title. IfFALSE, no title. If a character string, uses it as a custom title.- colors
Character vector of colors for categories. If
NULL(default), uses a colorblind-friendly palette.- linetype
Character or numeric vector specifying line types for
style = "line". IfNULL(default), uses solid lines. Only applies to line plots.- show_legend
Logical. If
TRUE(default), displays the legend.- legend_position
Character. Position of the legend. One of
"right"(default),"top","bottom","left","none".
Details
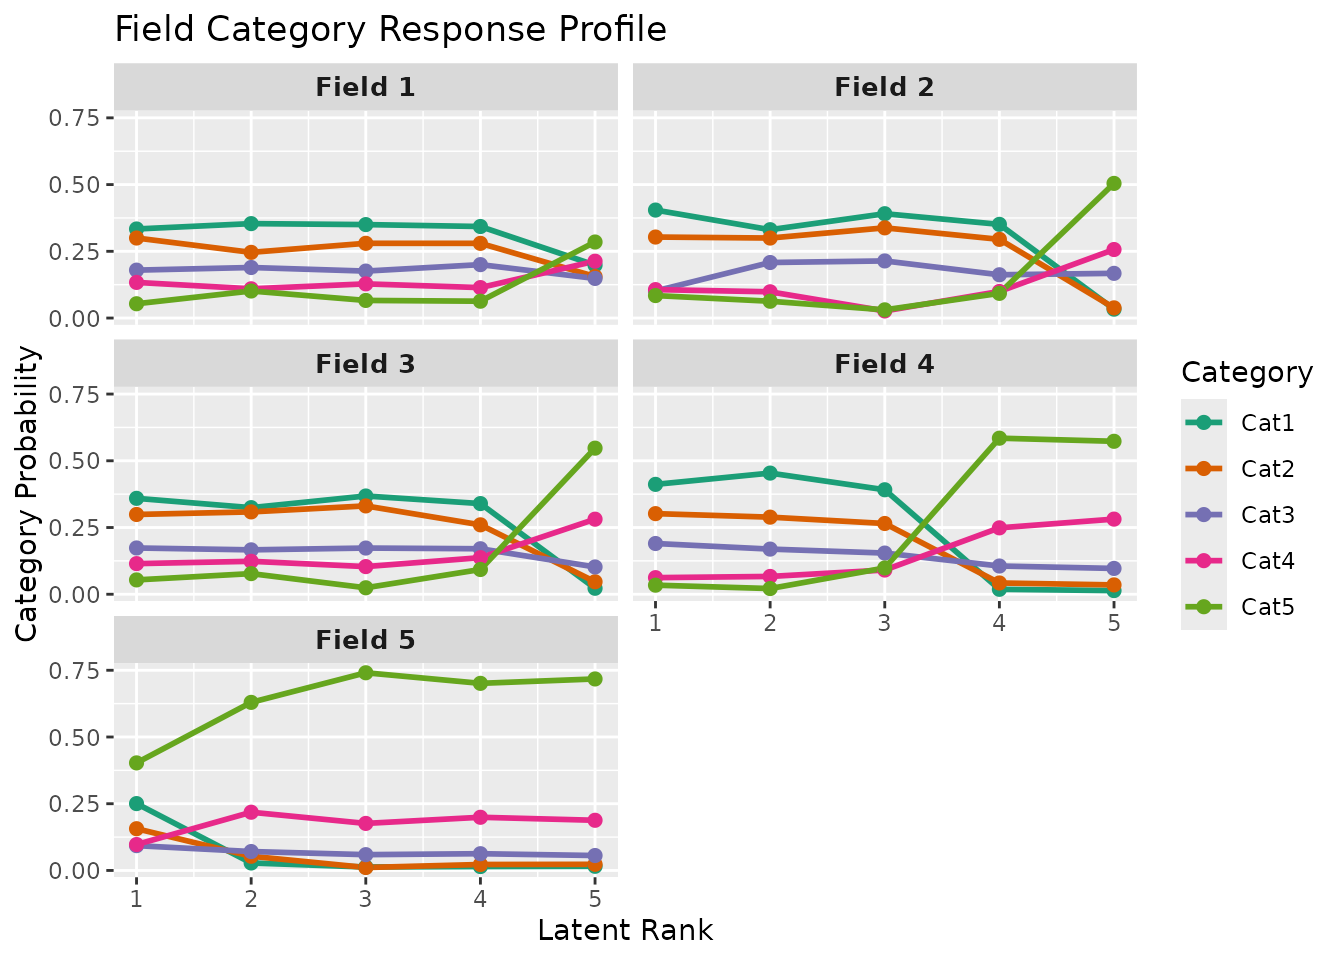
FCRP (Field Category Response Profile) visualizes how response category probabilities change across latent classes or ranks within each field. For each field, the plot shows \(P(response = k | class/rank)\) for all categories k. Probabilities sum to 1.0 for each class/rank.
This plot is only available for polytomous Biclustering models
(ordinalBiclustering, nominalBiclustering, or
ratedBiclustering) that have 3 or more response categories.
The style parameter allows two visualizations:
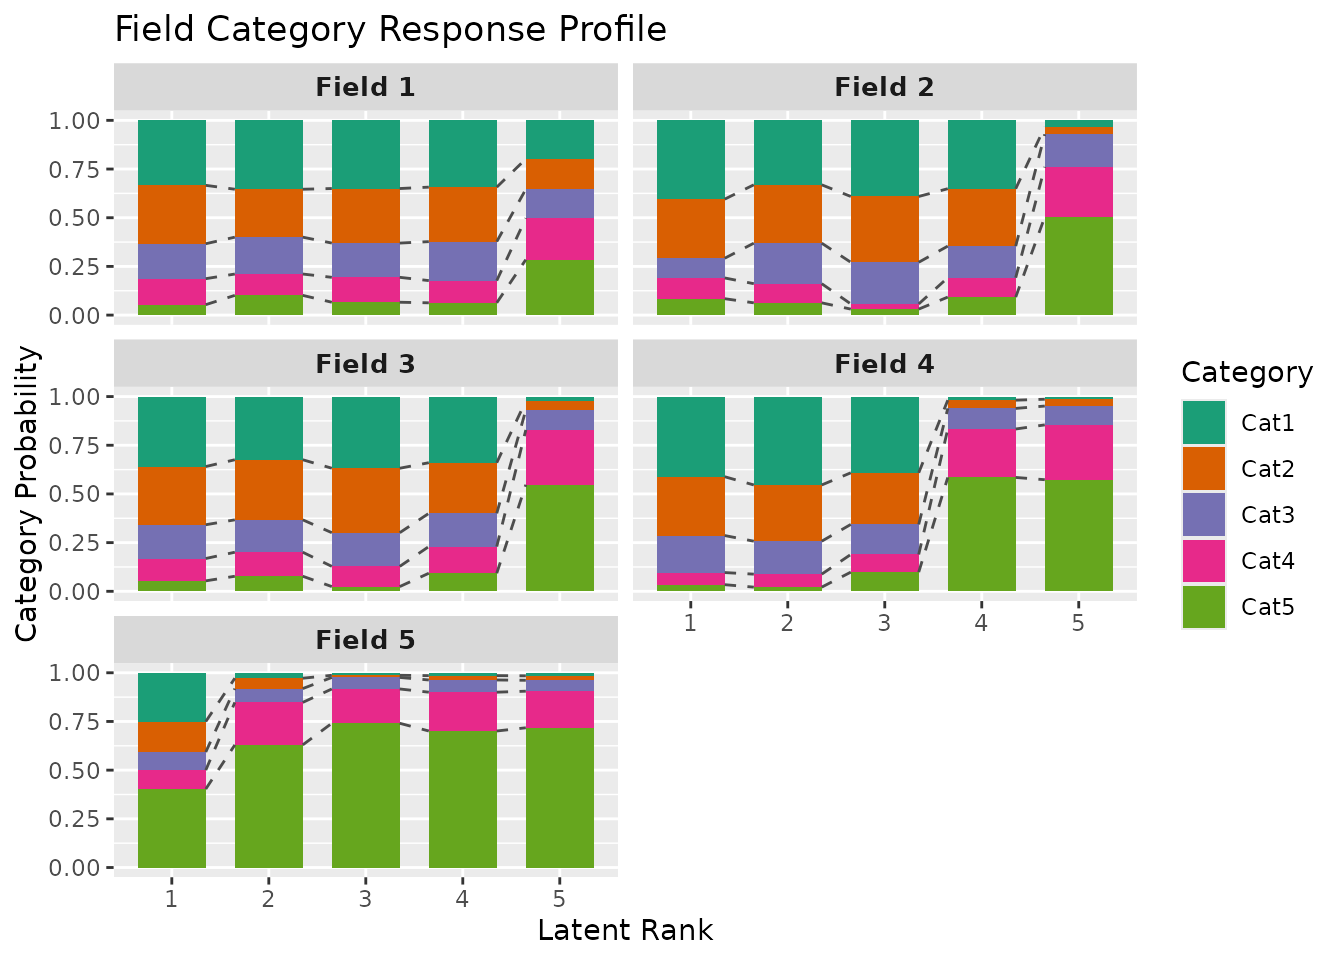
"line": Shows category probability curves as lines with points"bar": Shows stacked bar chart with category proportions
Examples
# \donttest{
library(exametrika)
# Ordinal Biclustering with 5 categories
result <- Biclustering(J35S500, ncls = 5, nfld = 5, method = "R")
# Line plot (default)
plotFCRP_gg(result, style = "line")
 # Stacked bar chart
plotFCRP_gg(result, style = "bar")
# Stacked bar chart
plotFCRP_gg(result, style = "bar")
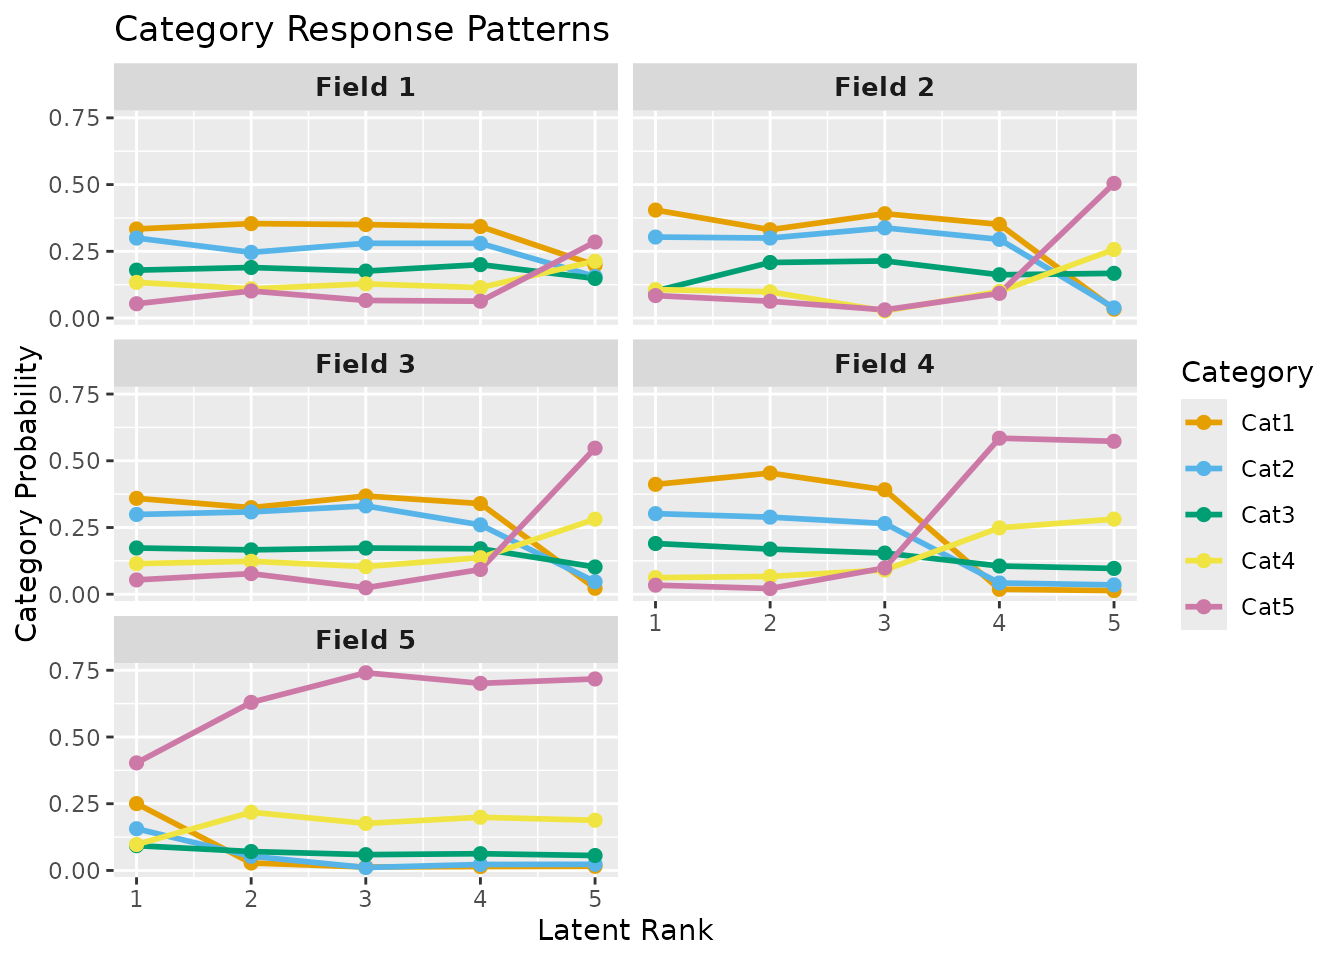
 # Custom styling
plotFCRP_gg(result,
style = "line",
title = "Category Response Patterns",
colors = c("#E69F00", "#56B4E9", "#009E73", "#F0E442", "#CC79A7")
)
# Custom styling
plotFCRP_gg(result,
style = "line",
title = "Category Response Patterns",
colors = c("#E69F00", "#56B4E9", "#009E73", "#F0E442", "#CC79A7")
)
 # }
# }