Plot Score-Field Heatmap (ScoreField) for Polytomous Biclustering
Source:R/ScoreField.R
plotScoreField_gg.RdCreates a heatmap visualization showing the expected scores for each field across latent classes or ranks in polytomous biclustering models (nominalBiclustering, ordinalBiclustering, ratedBiclustering).
The expected score for each field-class/rank combination is calculated as the sum of (category x probability) across all categories.
Usage
plotScoreField_gg(
  data,
  title = TRUE,
  colors = NULL,
  show_legend = TRUE,
  legend_position = "right",
  show_values = TRUE,
  text_size = 3.5
)
Arguments
- data
An exametrika model object from nominalBiclustering, ordinalBiclustering, or ratedBiclustering.
- title
Logical or character. If TRUE (default), displays an automatic title. If FALSE, no title is displayed. If a character string, uses it as the title.
- colors
Character vector of colors for the gradient, or NULL (default) to use a colorblind-friendly yellow-orange-red palette. If provided, should be a vector of at least 2 colors for the gradient.
- show_legend
Logical. If TRUE (default), displays the color scale legend.
- legend_position
Character. Position of the legend: "right" (default), "left", "top", "bottom", or "none".
- show_values
Logical. If TRUE (default), displays the expected score values as text on each cell of the heatmap.
- text_size
Numeric. Size of the text labels showing values (default: 3.5). Only used when show_values = TRUE.
Details
This function is designed for polytomous (multi-valued) biclustering models where items have more than two response categories. It displays the expected score (weighted sum of category probabilities) for each field across all latent classes or ranks.
The heatmap uses:
Y-axis: Fields (F1, F2, ...)
X-axis: Latent Classes (C1, C2, ...) or Ranks (R1, R2, ...)
Color: Expected score magnitude (lighter = lower, darker/redder = higher)
Text: Actual expected score values (optional, controlled by show_values)
Higher expected scores indicate that students in that class/rank are expected to achieve higher scores in that field.
See also
plotFCRP_gg for field category response profiles,
plotFCBR_gg for field cumulative boundary reference,
plotArray_gg for array plots,
plotScoreRank_gg for score-rank heatmaps
Examples
# \donttest{
library(exametrika)
# Ordinal Biclustering example
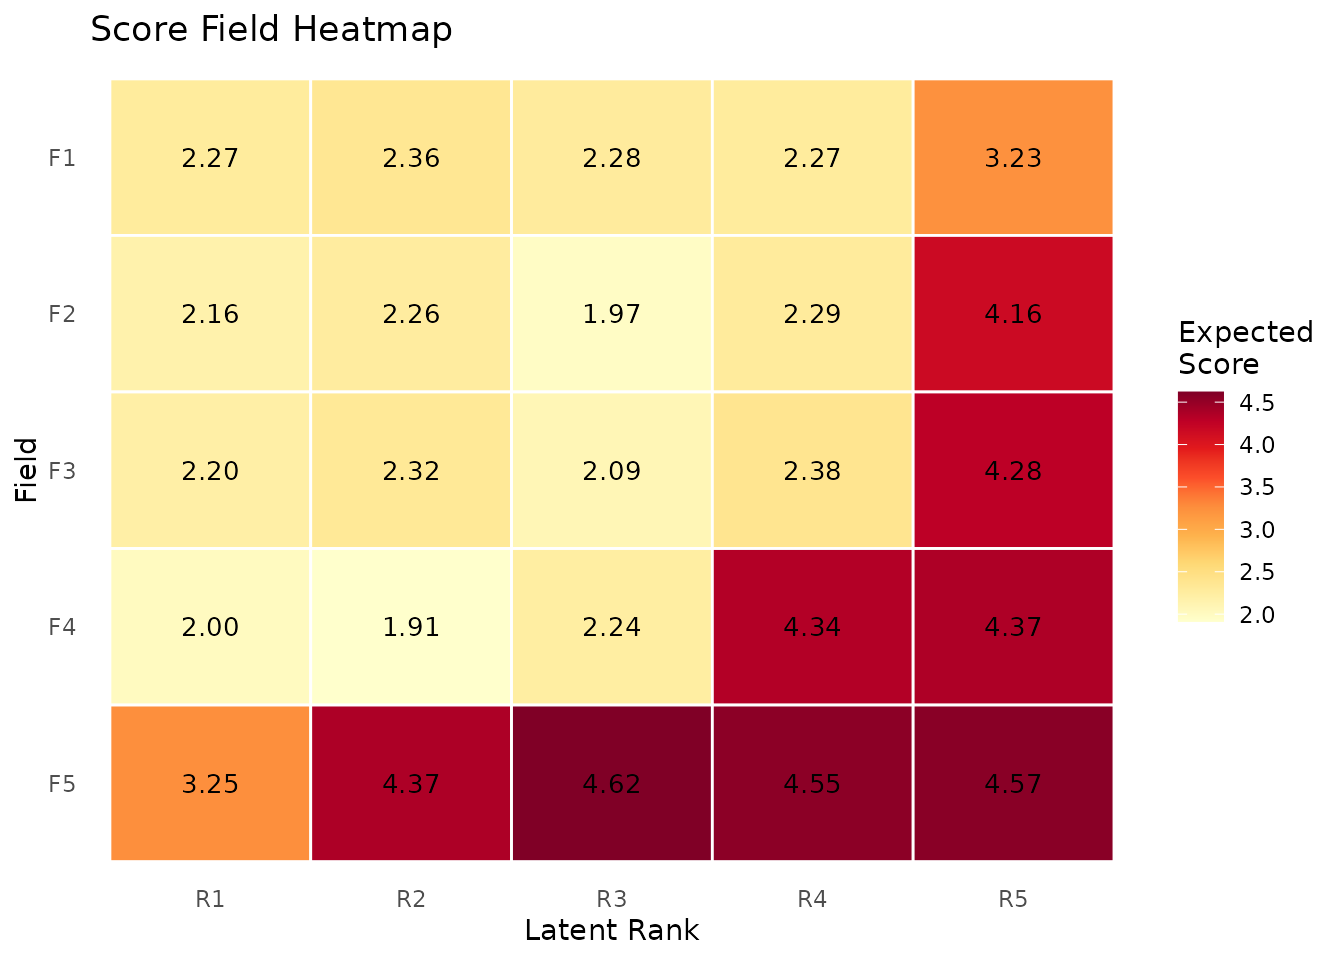
result <- Biclustering(J35S500, ncls = 5, nfld = 5, method = "R")
# Basic plot
plotScoreField_gg(result)
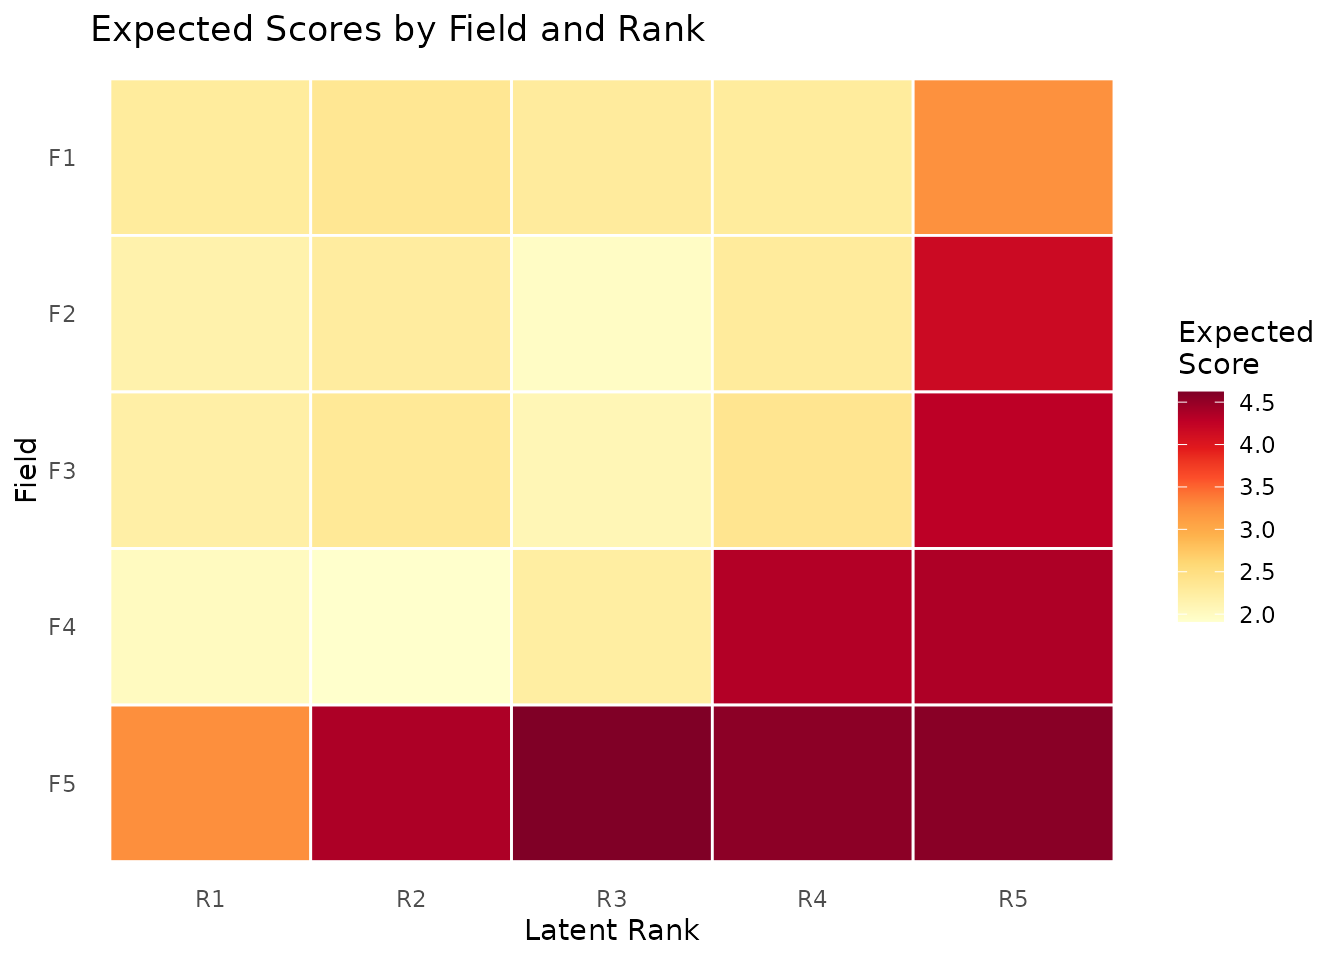
 # Custom title and hide values
plotScoreField_gg(result,
title = "Expected Scores by Field and Rank",
show_values = FALSE
)
# Custom title and hide values
plotScoreField_gg(result,
title = "Expected Scores by Field and Rank",
show_values = FALSE
)
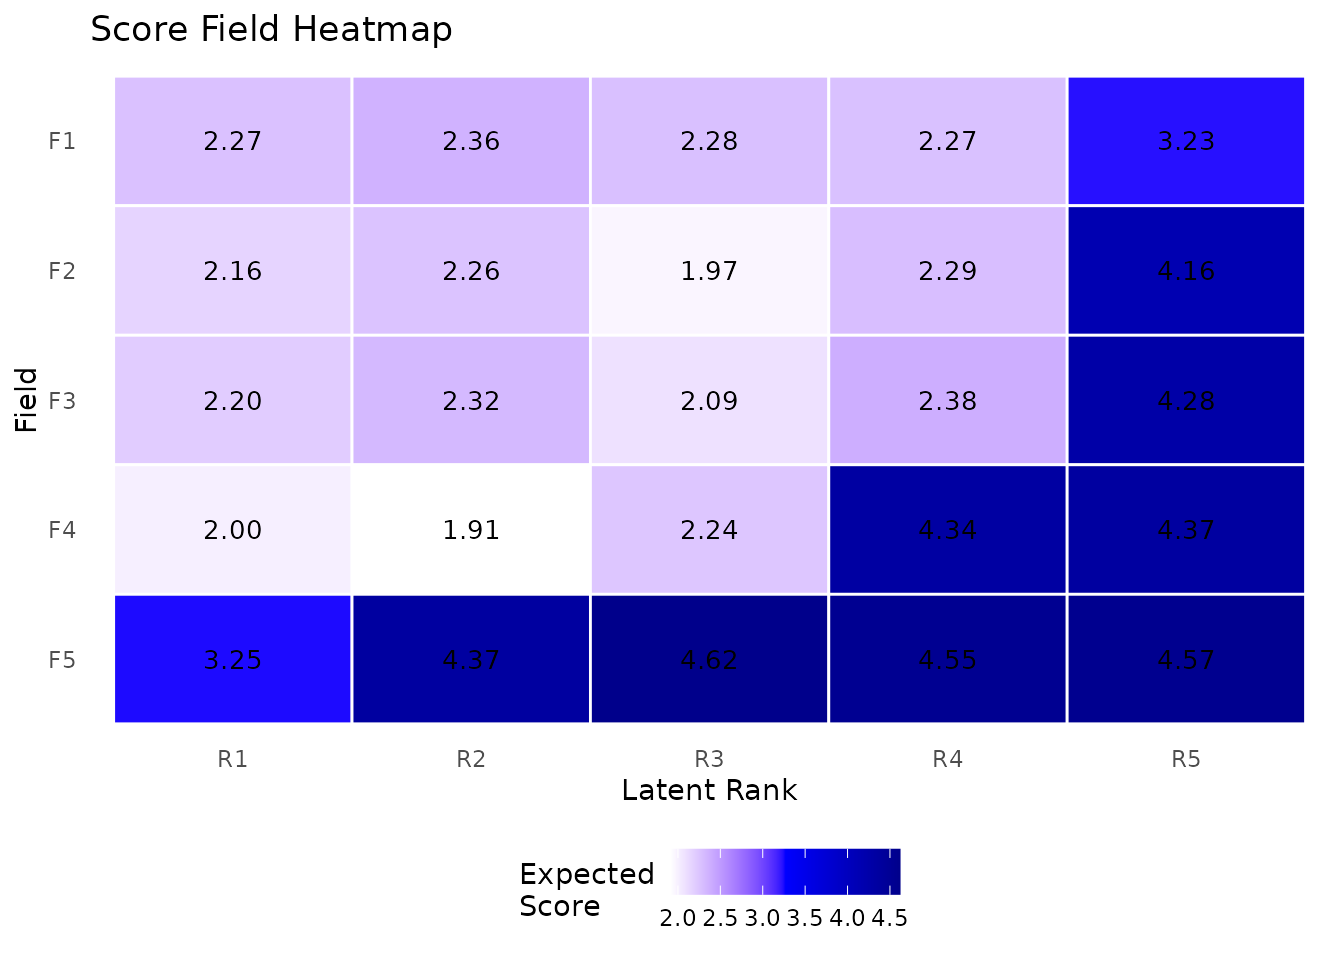
 # Custom color gradient
plotScoreField_gg(result,
colors = c("white", "blue", "darkblue"),
legend_position = "bottom"
)
# Custom color gradient
plotScoreField_gg(result,
colors = c("white", "blue", "darkblue"),
legend_position = "bottom"
)
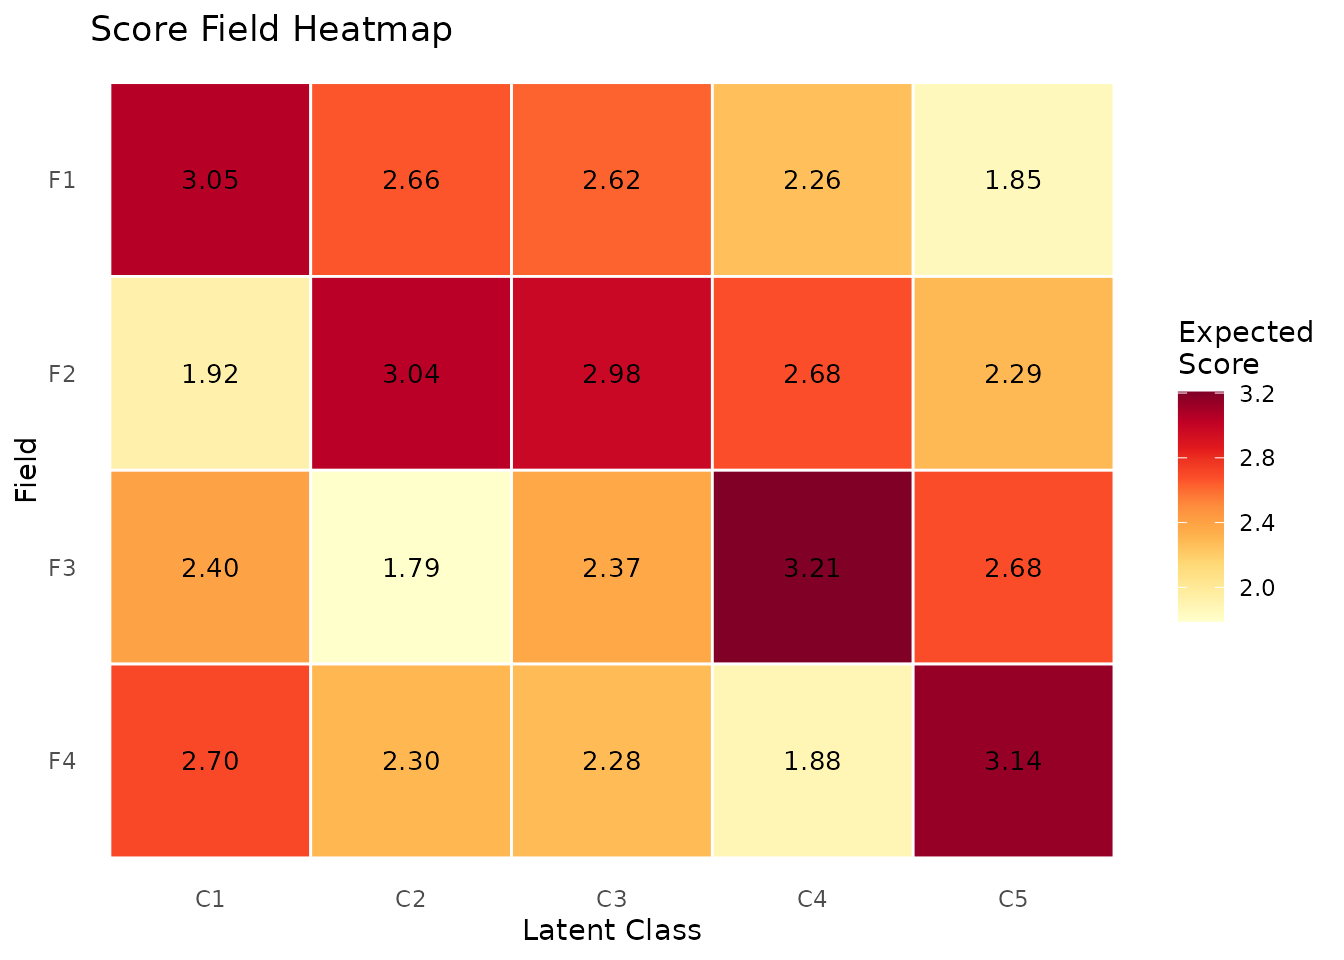
 # Nominal Biclustering example
data(J20S600)
result_nom <- Biclustering(J20S600, ncls = 5, nfld = 4)
plotScoreField_gg(result_nom)
# Nominal Biclustering example
data(J20S600)
result_nom <- Biclustering(J20S600, ncls = 5, nfld = 4)
plotScoreField_gg(result_nom)
 # }
# }