This function takes exametrika ordinalBiclustering output as input and generates a Field Cumulative Boundary Reference (FCBR) plot using ggplot2. The plot shows cumulative probability curves for each category boundary across latent classes or ranks. For each field, multiple lines represent the probability of scoring at or above each category boundary.
Usage
plotFCBR_gg(
  data,
  fields = NULL,
  title = TRUE,
  colors = NULL,
  linetype = NULL,
  show_legend = TRUE,
  legend_position = "right"
)
Arguments
- data
An object of class
c("exametrika", "ordinalBiclustering")fromexametrika::Biclustering()withdataType = "ordinal".- fields
Integer vector specifying which fields to plot. Default is all fields.
- title
Logical or character. If
TRUE(default), display field labels as subplot titles. IfFALSE, no titles. If a character string, use it as the main plot title.- colors
Character vector. Colors for category boundary lines. If
NULL(default), uses the package default palette.- linetype
Character or numeric vector. Line types for category boundaries. If
NULL(default), uses automatic line type assignment.- show_legend
Logical. If
TRUE, display the legend showing boundary labels. Default isTRUE.- legend_position
Character. Position of the legend. One of
"right"(default),"top","bottom","left","none".
Details
The Field Cumulative Boundary Reference (FCBR) visualizes how the probability of reaching each category boundary changes across latent classes or ranks in ordinal biclustering. This is particularly useful for understanding the difficulty of each response category threshold across different ability levels.
For a field with \(K\) categories (1, 2, ..., K), the FCBR shows:
Line 1: P(response >= 1 | class/rank) = 1.0 (always)
Line 2: P(response >= 2 | class/rank)
Line 3: P(response >= 3 | class/rank)
...
Line K: P(response >= K | class/rank)
The boundary probabilities are calculated by summing the probabilities of all categories at or above the boundary threshold. P(Q>=1) is always 1.0 and appears as a horizontal line at the top. Higher classes/ranks (higher ability) typically show higher probabilities for higher boundaries.
Examples
# \donttest{
library(exametrika)
# Ordinal biclustering example with polytomous data
result <- Biclustering(J35S500, ncls = 4, nfld = 5)
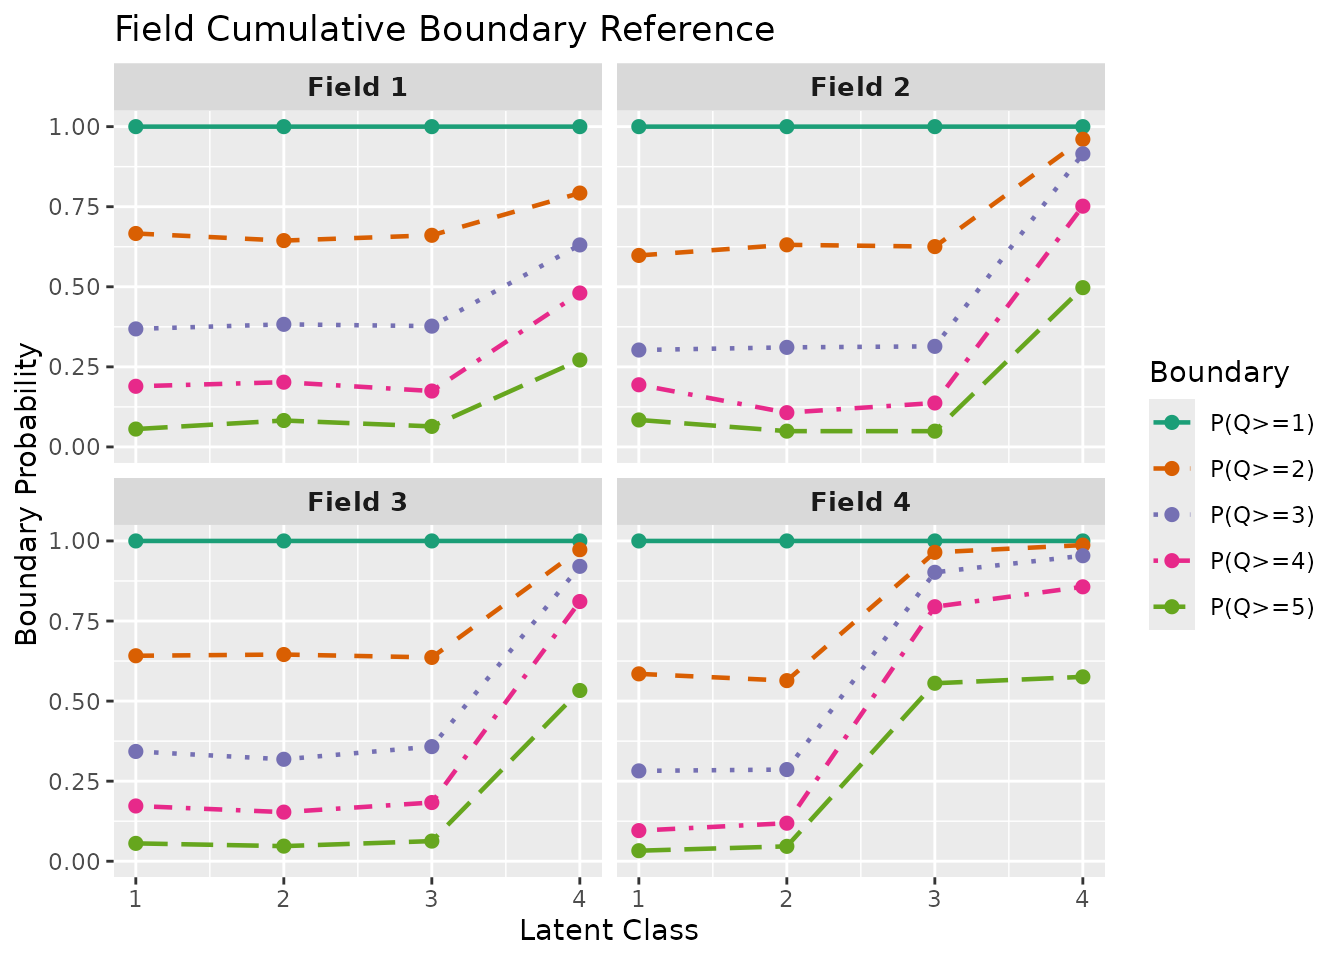
# Plot first 4 fields
plot <- plotFCBR_gg(result, fields = 1:4)
plot
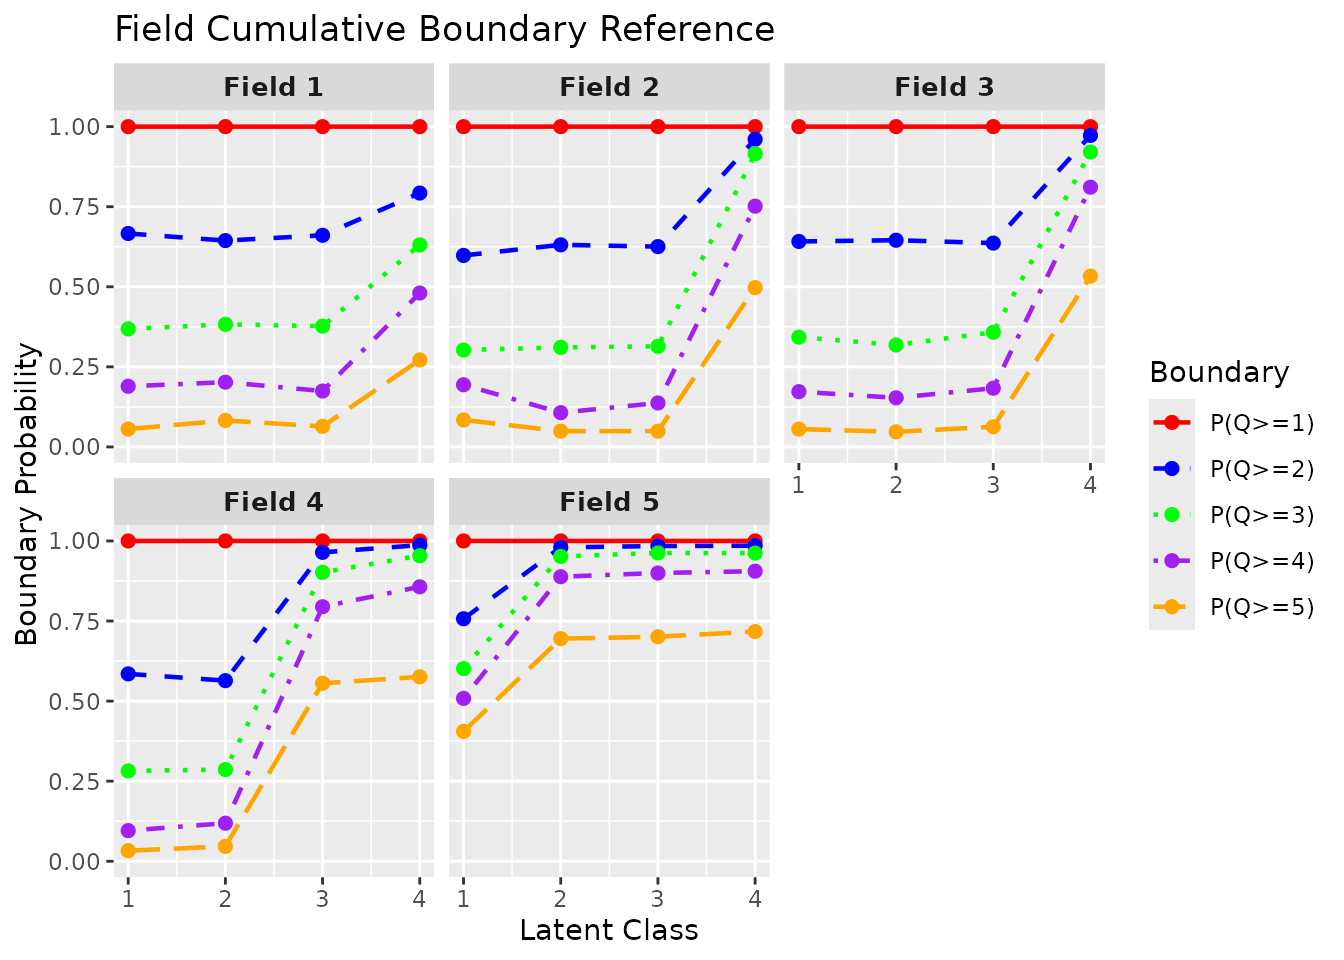
 # Custom colors and title (5 colors needed for 5-category ordinal data)
plot <- plotFCBR_gg(result,
fields = 1:5,
title = "Field Cumulative Boundary Reference",
colors = c("red", "blue", "green", "purple", "orange")
)
plot
# Custom colors and title (5 colors needed for 5-category ordinal data)
plot <- plotFCBR_gg(result,
fields = 1:5,
title = "Field Cumulative Boundary Reference",
colors = c("red", "blue", "green", "purple", "orange")
)
plot
 # }
# }