This function takes exametrika LRAordinal output as input and generates an Item Category Boundary Response (ICBR) plot using ggplot2. The plot shows cumulative probability curves for each category boundary across latent ranks. For each item, multiple lines represent the probability of scoring at or above each category boundary.
Usage
plotICBR_gg(
  data,
  items = NULL,
  title = TRUE,
  colors = NULL,
  linetype = NULL,
  show_legend = TRUE,
  legend_position = "right"
)
Arguments
- data
An object of class
c("exametrika", "LRAordinal")fromexametrika::LRA()withdataType = "ordinal".- items
Integer vector specifying which items to plot. Default is all items.
- title
Logical or character. If
TRUE(default), display item labels as subplot titles. IfFALSE, no titles. If a character string, use it as the main plot title.- colors
Character vector. Colors for category boundary lines. If
NULL(default), uses the package default palette.- linetype
Character or numeric vector. Line types for category boundaries. If
NULL(default), uses automatic line type assignment.- show_legend
Logical. If
TRUE, display the legend showing category labels. Default isTRUE.- legend_position
Character. Position of the legend. One of
"right"(default),"top","bottom","left","none".
Value
A single ggplot object with faceted subplots for each item, or a combined plot using gridExtra if faceting is not suitable.
Details
The Item Category Boundary Response (ICBR) visualizes how the probability of reaching each category boundary changes across latent ranks. This is particularly useful for understanding the difficulty of each response category in ordinal items.
For an item with \(K\) categories (0, 1, ..., K-1), the ICBR shows:
Line 1: P(response >= 1 | rank)
Line 2: P(response >= 2 | rank)
...
Line K-1: P(response >= K-1 | rank)
Ranks are shown in natural order (rank 1, rank 2, ...), matching the base plots of the parent exametrika package.
Examples
library(exametrika)
# \donttest{
result <- LRA(J15S3810, nrank = 4, dataType = "ordinal")
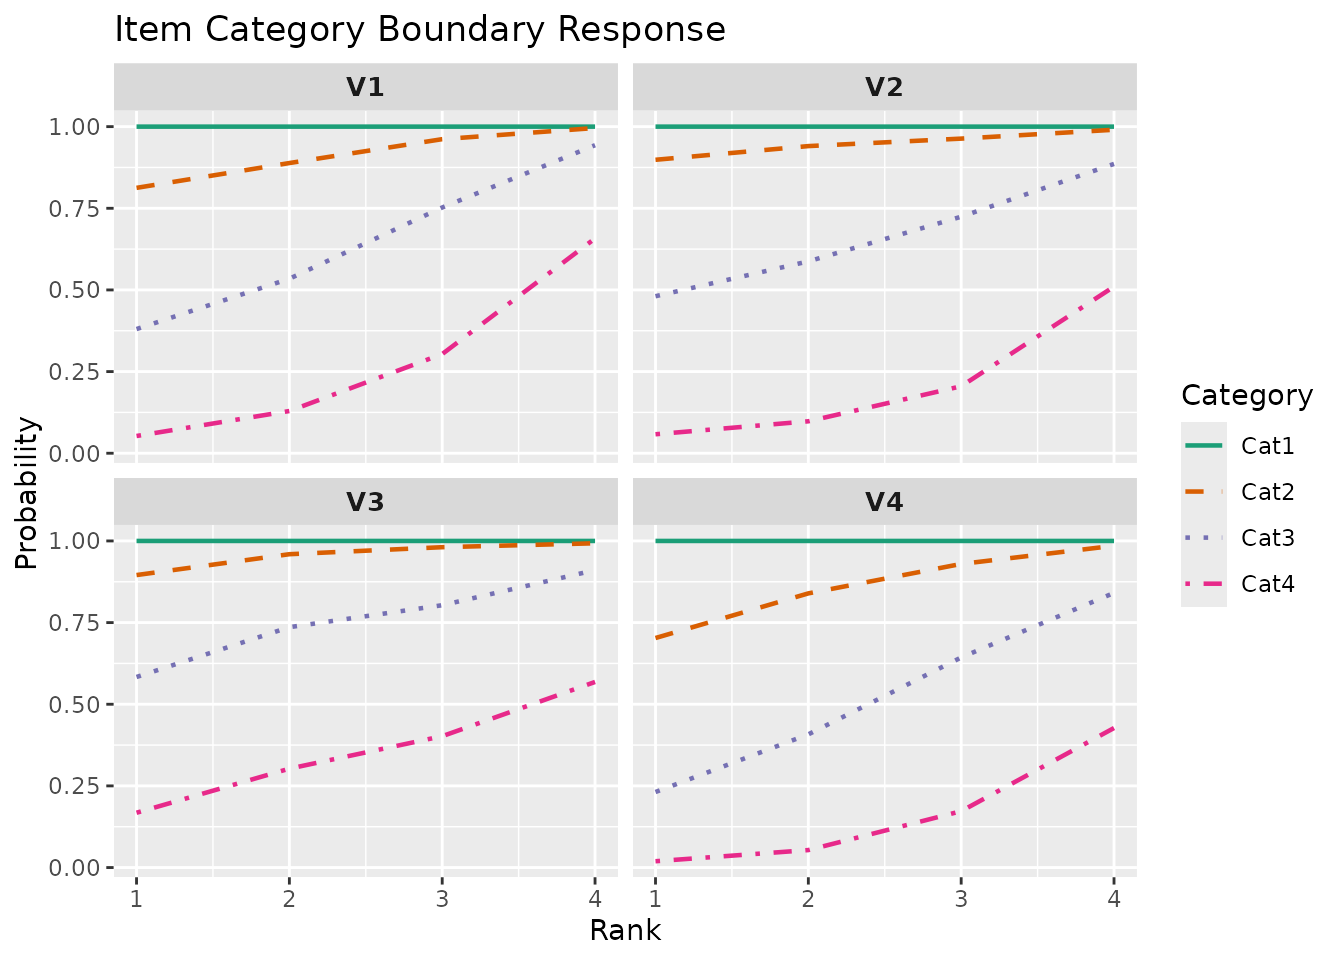
# Plot first 4 items
plot <- plotICBR_gg(result, items = 1:4)
plot
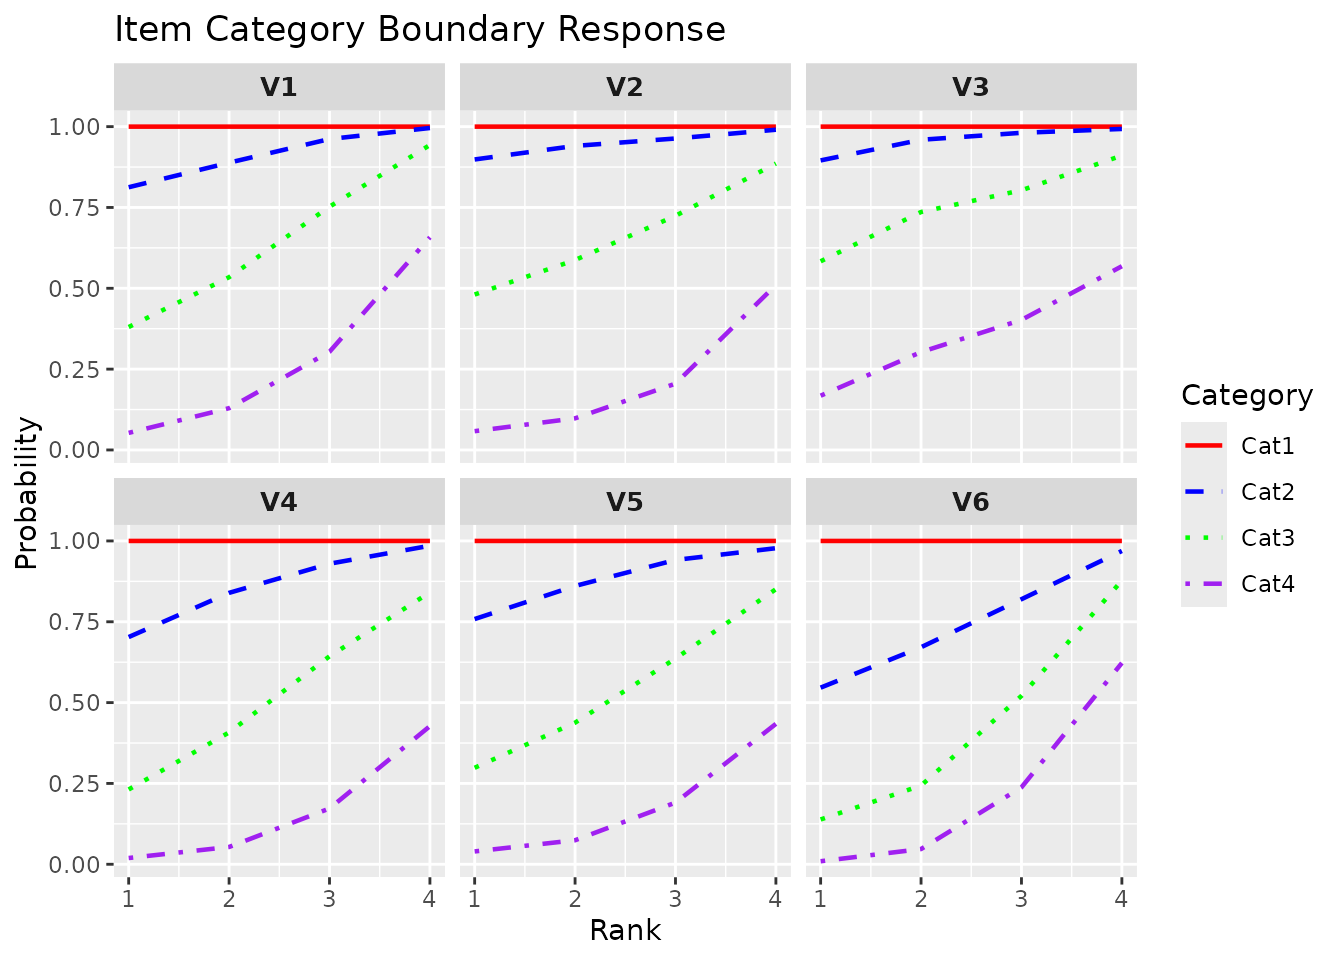
 # Custom colors and title
plot <- plotICBR_gg(result,
items = 1:6,
title = "Item Category Boundary Response",
colors = c("red", "blue", "green", "purple")
)
plot
# Custom colors and title
plot <- plotICBR_gg(result,
items = 1:6,
title = "Item Category Boundary Response",
colors = c("red", "blue", "green", "purple")
)
plot
 # }
# }