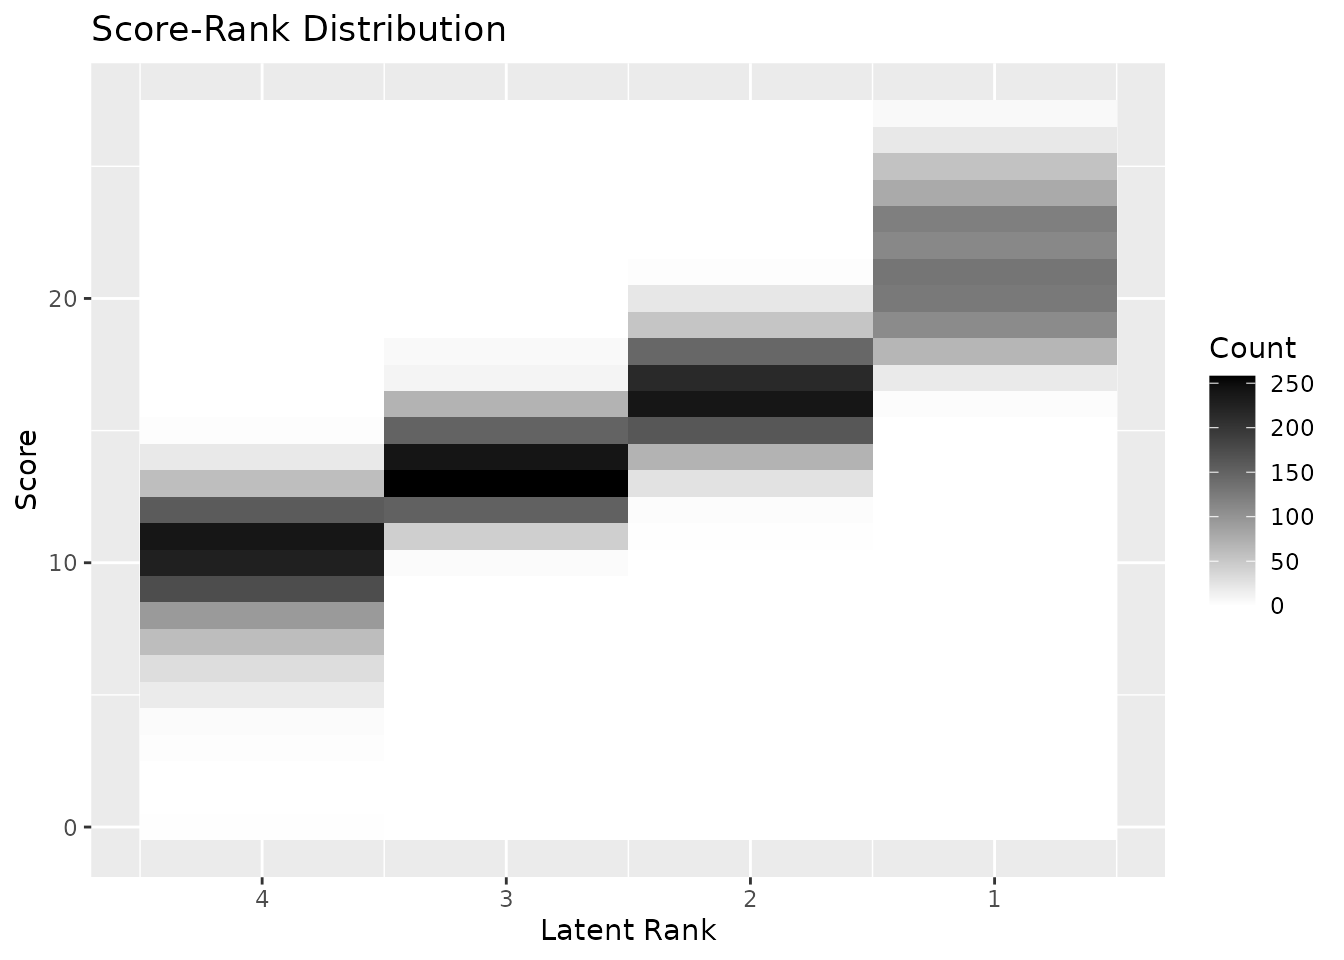
This function takes exametrika LRAordinal or LRArated output as input and generates a Score-Rank heatmap using ggplot2. The heatmap shows the distribution of students across scores (y-axis) and latent ranks (x-axis), with darker cells indicating higher frequency.
Usage
plotScoreRank_gg(
  data,
  title = TRUE,
  colors = NULL,
  show_legend = TRUE,
  legend_position = "right"
)
Arguments
- data
An object of class
c("exametrika", "LRAordinal")orc("exametrika", "LRArated")fromexametrika::LRA().- title
Logical or character. If
TRUE(default), display an auto-generated title. IfFALSE, no title. If a character string, use it as a custom title.- colors
Character vector of length 2. Low and high colors for the gradient. If
NULL(default), white-to-black grayscale is used (matching exametrika's original output).- show_legend
Logical. If
TRUE(default), display the color scale legend.- legend_position
Character. Position of the legend. One of
"right"(default),"top","bottom","left","none".
Details
The Score-Rank heatmap visualizes the joint distribution of observed scores and estimated latent ranks. Each cell represents the number of students with a given score assigned to a given rank. Darker cells indicate higher frequency.
The data is taken from data$ScoreRank, a matrix where rows
represent scores and columns represent latent ranks.
Examples
library(exametrika)
result <- LRA(J15S3810, nrank = 4, dataType = "ordinal")
plot <- plotScoreRank_gg(result)
plot