This function takes exametrika LRAordinal or LRArated output as input and generates an Item Category Reference Profile (ICRP) plot using ggplot2. The plot shows response probability curves for each category across latent ranks. For each item, multiple lines represent the probability of selecting each response category.
Usage
plotICRP_gg(
  data,
  items = NULL,
  title = TRUE,
  colors = NULL,
  linetype = NULL,
  show_legend = TRUE,
  legend_position = "right"
)
Arguments
- data
An object of class
c("exametrika", "LRAordinal")orc("exametrika", "LRArated")fromexametrika::LRA().- items
Integer vector specifying which items to plot. Default is all items.
- title
Logical or character. If
TRUE(default), display item labels as subplot titles. IfFALSE, no titles. If a character string, use it as the main plot title.- colors
Character vector. Colors for category lines. If
NULL(default), uses the package default palette.- linetype
Character or numeric vector. Line types for categories. If
NULL(default), uses automatic line type assignment.- show_legend
Logical. If
TRUE, display the legend showing category labels. Default isTRUE.- legend_position
Character. Position of the legend. One of
"right"(default),"top","bottom","left","none".
Details
The Item Category Reference Profile (ICRP) visualizes how the response probability for each category changes across latent ranks. Unlike ICBR which shows cumulative probabilities, ICRP shows the raw probability of selecting each specific category.
For an item with \(K\) categories (0, 1, ..., K-1), the ICRP shows:
Line for Cat0: P(response = 0 | rank)
Line for Cat1: P(response = 1 | rank)
...
Line for CatK: P(response = K | rank)
The sum of all probabilities at each rank equals 1.0, as they represent mutually exclusive response options.
Ranks are shown in natural order (rank 1, rank 2, ...), matching the base plots of the parent exametrika package.
Examples
library(exametrika)
# \donttest{
result <- LRA(J15S3810, nrank = 4, dataType = "ordinal")
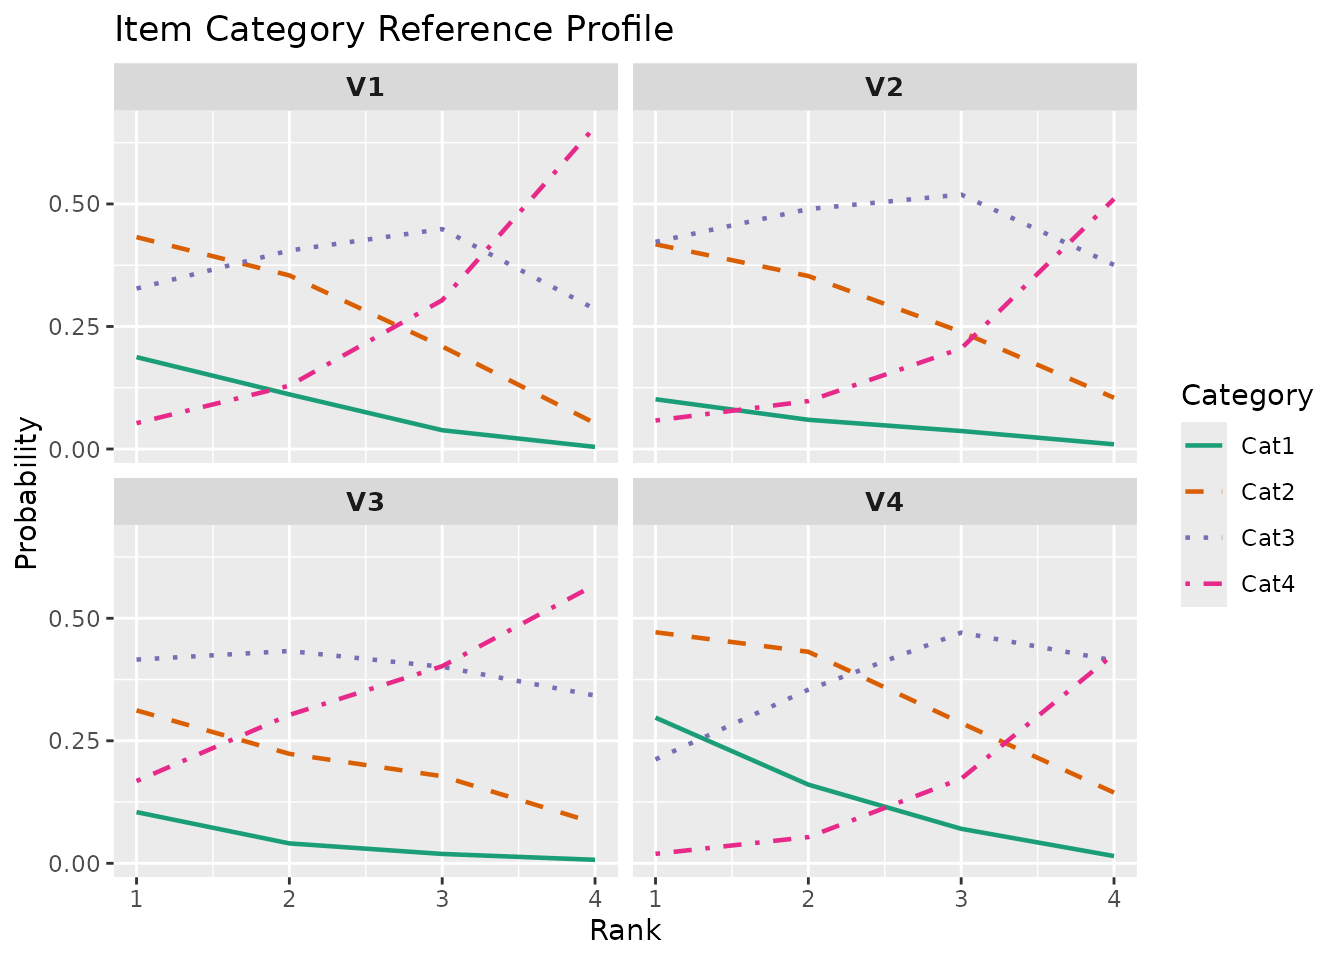
# Plot first 4 items
plot <- plotICRP_gg(result, items = 1:4)
plot
 # Custom colors and title
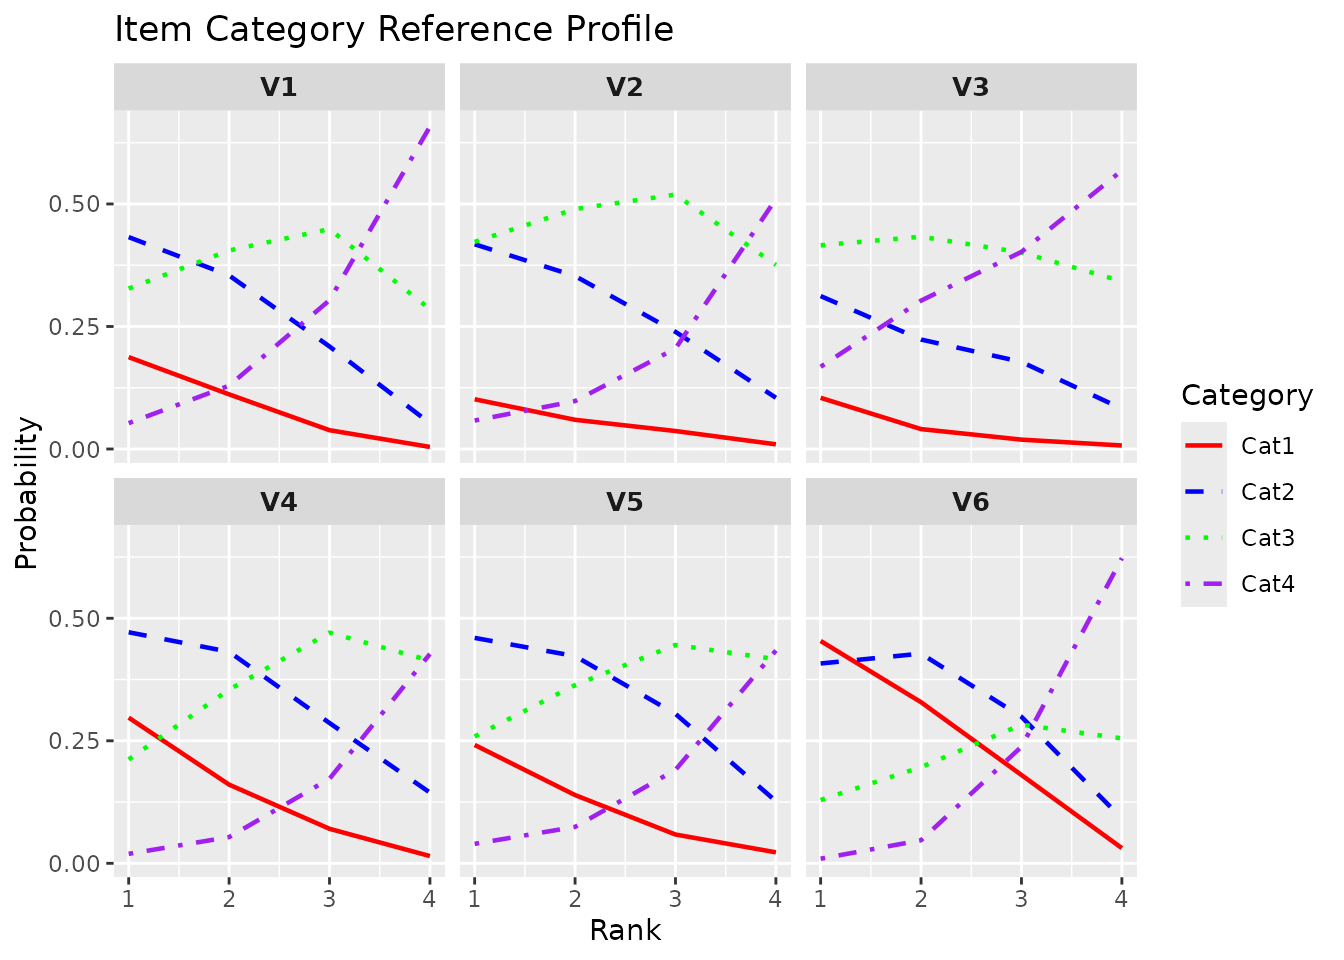
plot <- plotICRP_gg(result,
items = 1:6,
title = "Item Category Reference Profile",
colors = c("red", "blue", "green", "purple")
)
plot
# Custom colors and title
plot <- plotICRP_gg(result,
items = 1:6,
title = "Item Category Reference Profile",
colors = c("red", "blue", "green", "purple")
)
plot
 # }
# }